> For the complete documentation index, see [llms.txt](https://mariadb.com/docs/llms.txt). Markdown versions of documentation pages are available by appending `.md` to page URLs; this page is available as [Markdown](https://mariadb.com/docs/tools/mariadb-enterprise-manager/administration/deployment/adding-databases/add-multiple-maxscale-monitors.md).
# Add Multiple MaxScale Monitors
Explains how to monitor multiple logical databases or clusters managed by a single MaxScale deployment by adding or changing specific MaxScale monitors in the UI.
MariaDB Enterprise Manager allows you to monitor multiple logical databases or clusters that are managed by the same set of high-availability MaxScale instances. After adding your first MaxScale instance, you can easily add more monitors to track different services without re-entering the connection details.
{% hint style="info" %}
Default Monitor Behavior
If you add a database from a MaxScale setup that has multiple monitors and do not explicitly select one, Enterprise Manager will **automatically assign the first available monitor** by default. To ensure you are tracking the correct service, it's best to specify the monitor manually.
{% endhint %}
## Adding an Additional Monitor
Follow these steps to add another logical database that is monitored by the same MaxScale deployment.
{% stepper %}
{% step %}
**Add a new monitored logical database**
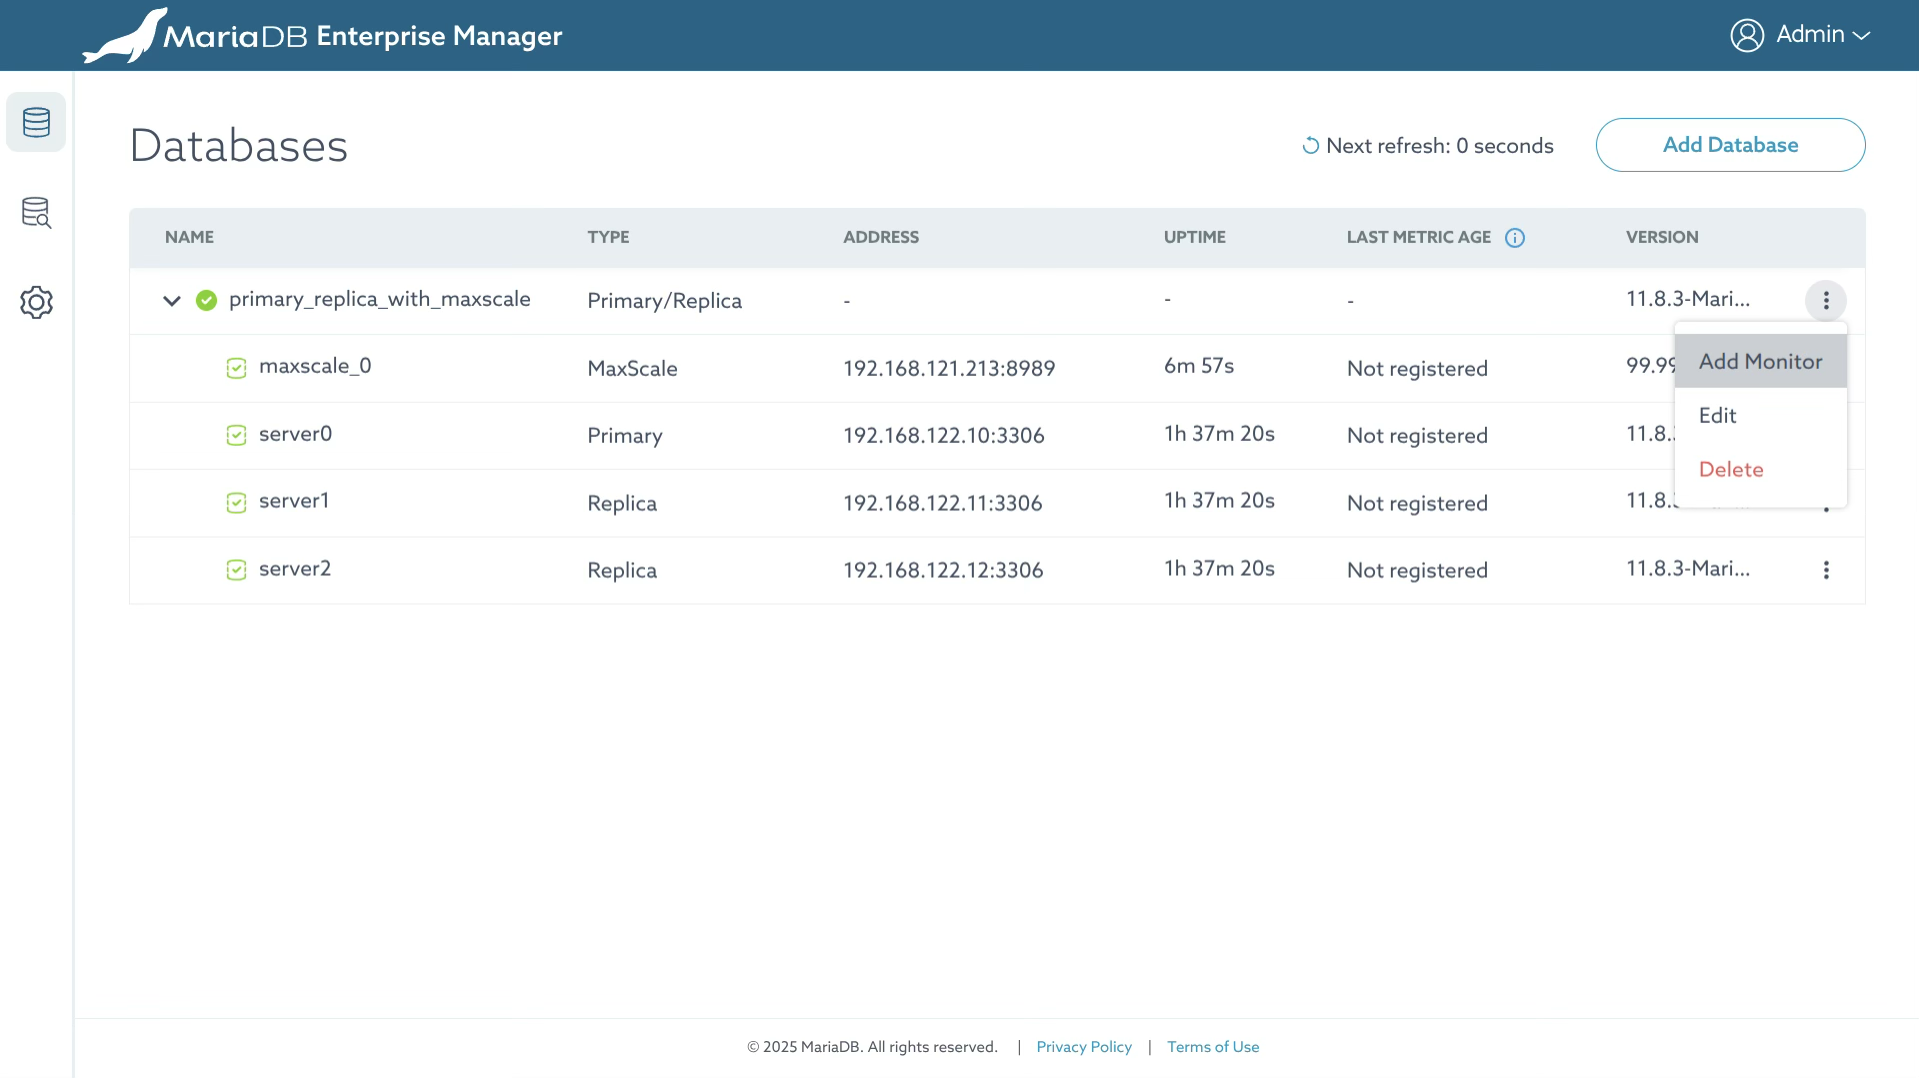
1. Navigate to your main database inventory page.
2. Locate the existing logical database that is associated with your MaxScale deployment.
3. Click the **three-dot menu icon (⋮)** on the right side of the database entry to open the context menu and select **Add Monitor**.
 {% endstep %}
{% step %}
**Configure the new monitor**
1. In the dialog box that appears, provide a new **Logical Database Name** and select the specific **MaxScale Monitor** you wish to track from the dropdown list.
2. Click the **Confirm** button to add the new monitored database.
{% endstep %}
{% endstepper %}
## Changing the Monitor for an Existing Database
If you need to change which MaxScale monitor an existing logical database is tracking, follow these steps.
{% stepper %}
{% step %}
**Open the database edit menu**
1. Navigate to your main database inventory page and locate the logical database you wish to edit.
2. Click the **three-dot menu icon (⋮)** on the right side of the database entry.
3. Select the **Edit** option from the menu.
{% endstep %}
{% step %}
**Configure the new monitor**
1. In the dialog box that appears, provide a new **Logical Database Name** and select the specific **MaxScale Monitor** you wish to track from the dropdown list.
2. Click the **Confirm** button to add the new monitored database.
{% endstep %}
{% endstepper %}
## Changing the Monitor for an Existing Database
If you need to change which MaxScale monitor an existing logical database is tracking, follow these steps.
{% stepper %}
{% step %}
**Open the database edit menu**
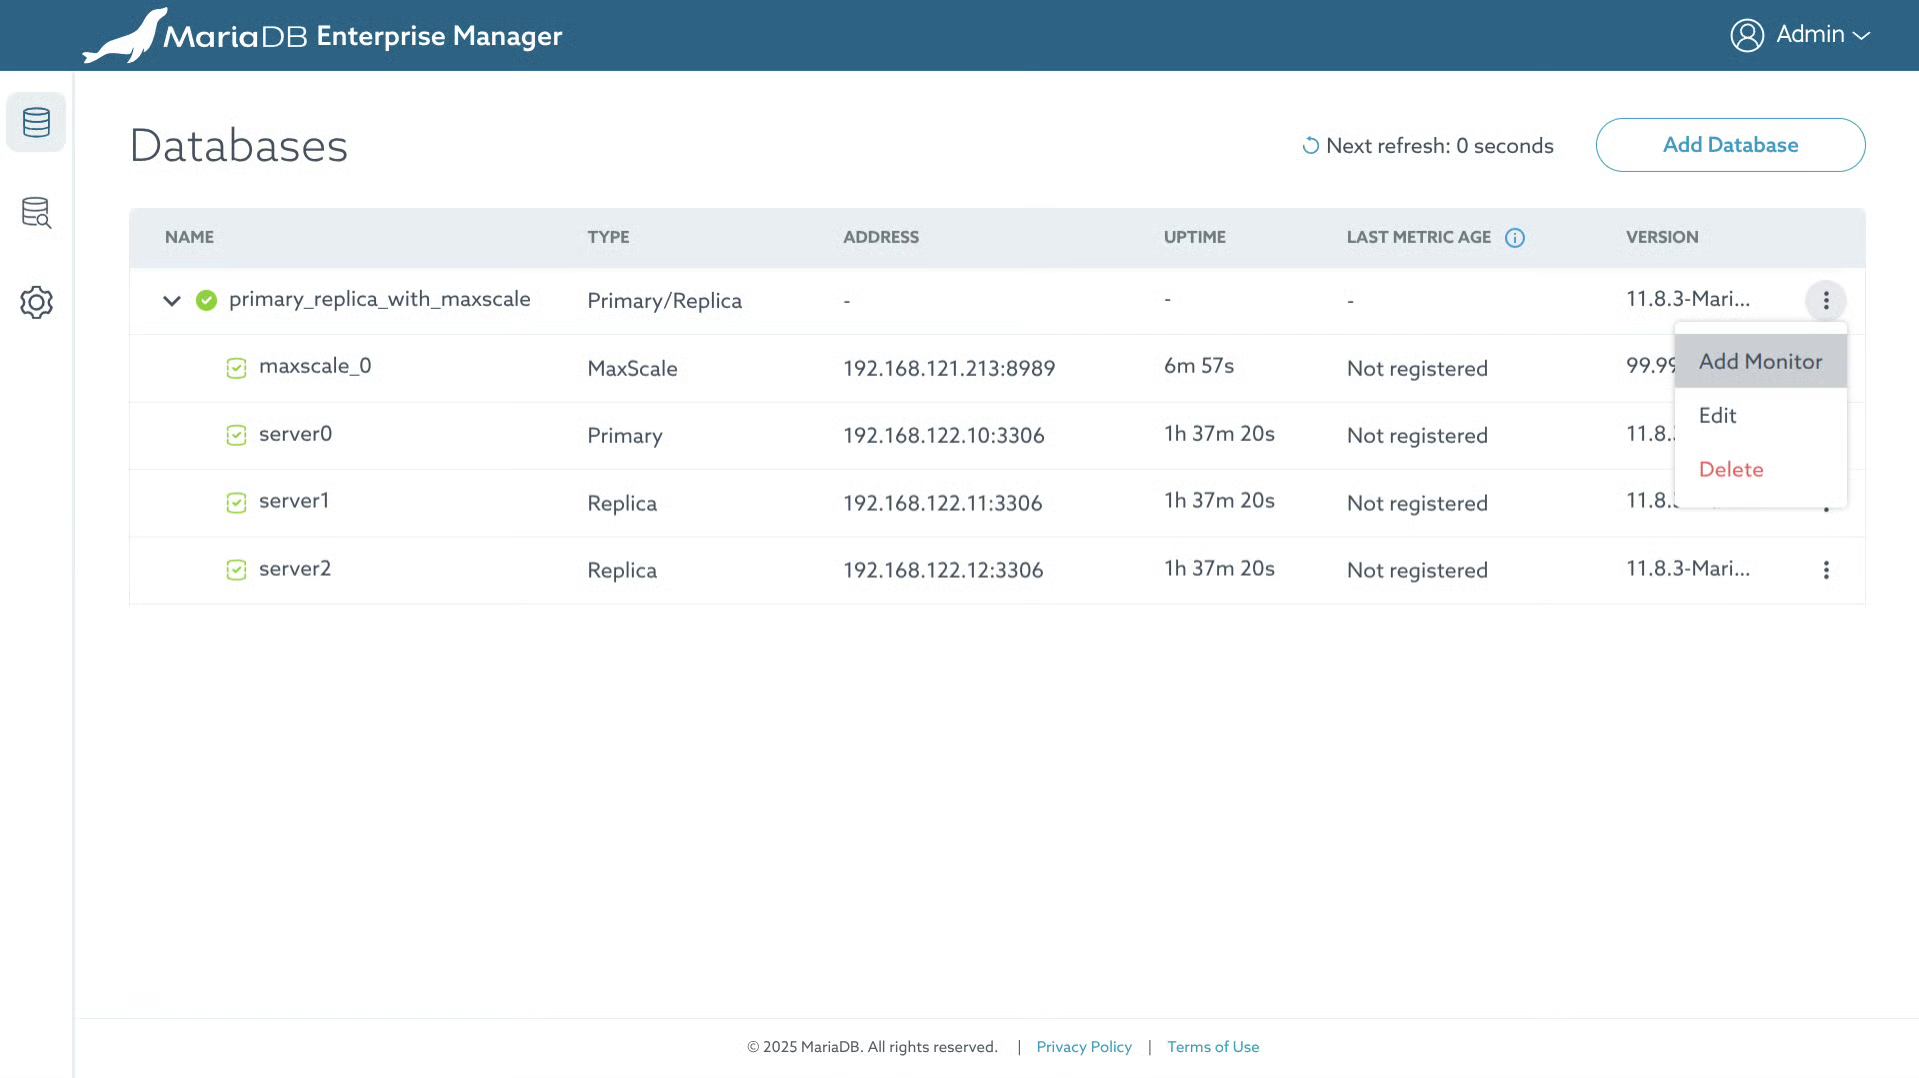
1. Navigate to your main database inventory page and locate the logical database you wish to edit.
2. Click the **three-dot menu icon (⋮)** on the right side of the database entry.
3. Select the **Edit** option from the menu.
 {% endstep %}
{% step %}
**Select a different monitor**
1. In the configuration window, scroll down to the **Advanced** section.
2. From the **Monitor name** dropdown, select the new MaxScale monitor you want this logical database to track.
{% endstep %}
{% step %}
**Select a different monitor**
1. In the configuration window, scroll down to the **Advanced** section.
2. From the **Monitor name** dropdown, select the new MaxScale monitor you want this logical database to track.
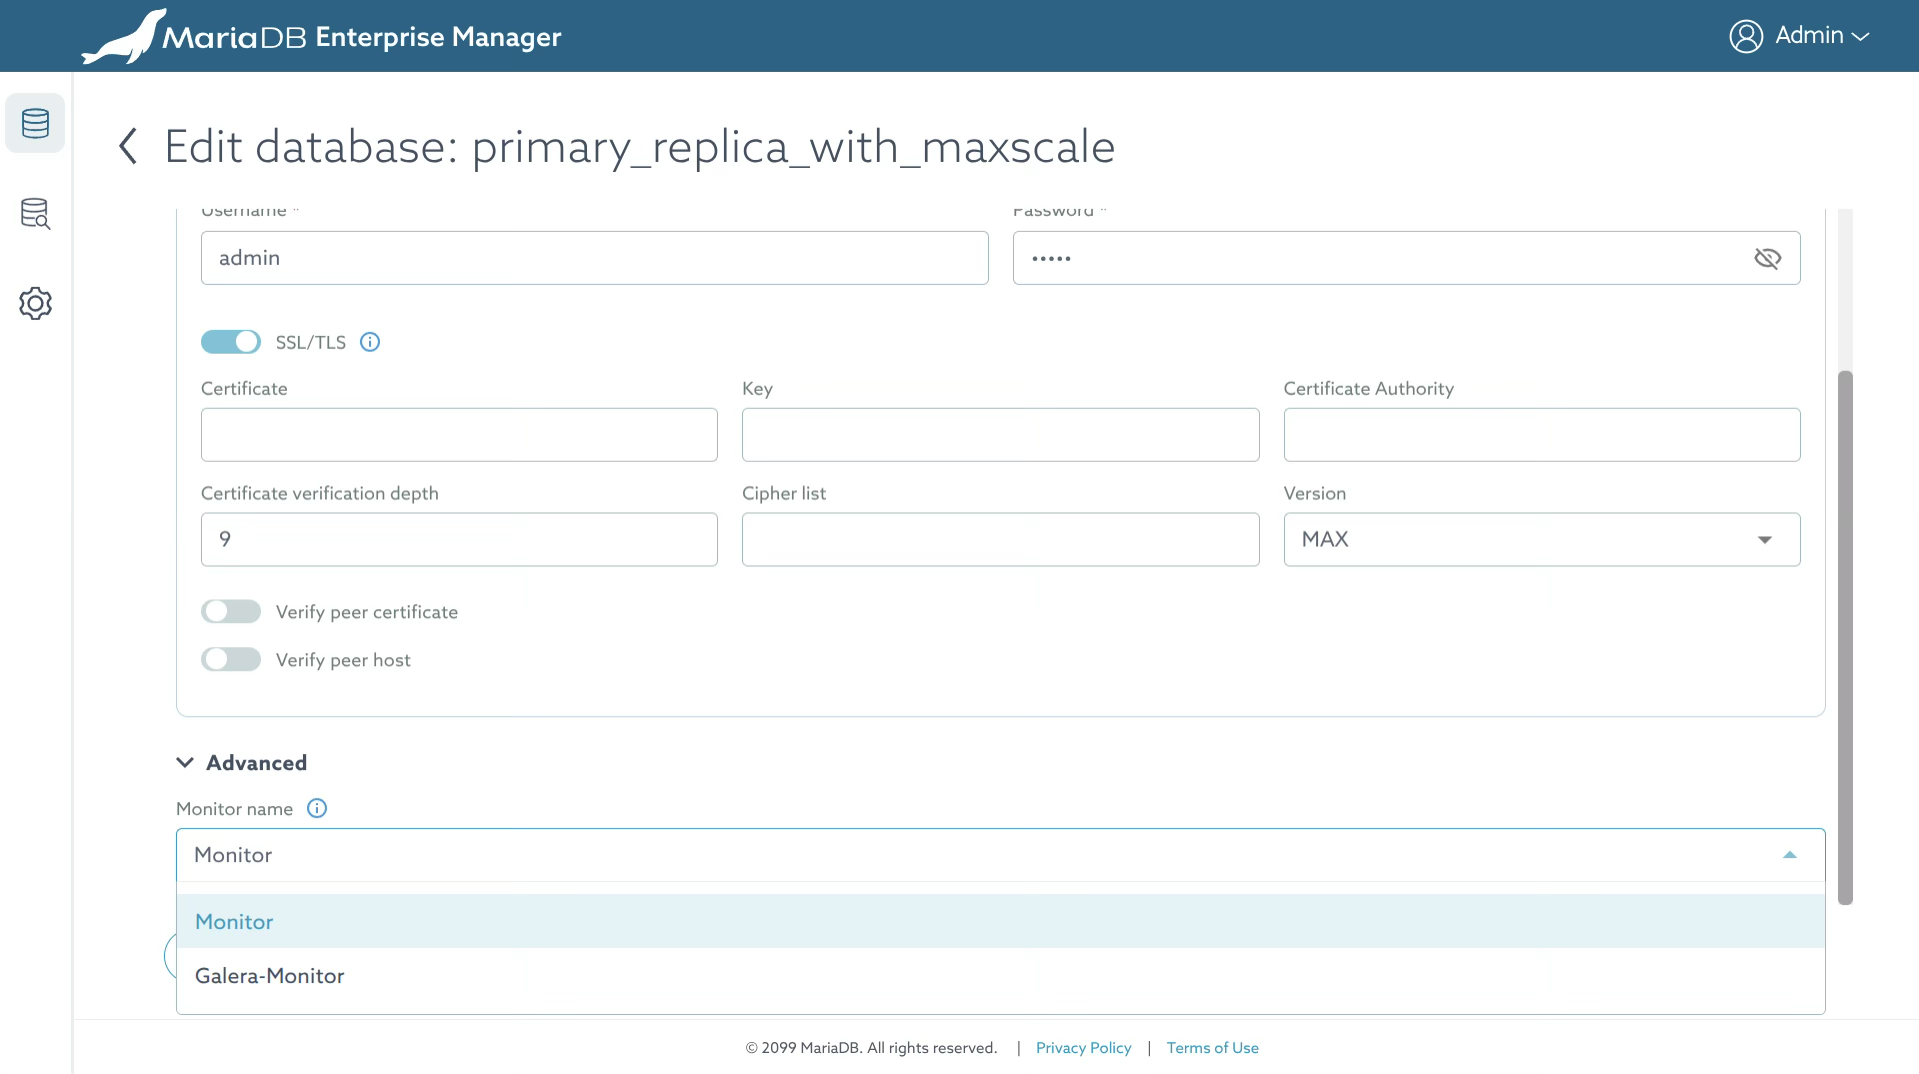 3. Click the **Confirm** button to save your changes.
{% endstep %}
{% endstepper %}
*This page is: Copyright © 2026 MariaDB. All rights reserved.*
{% @marketo/form formId="4316" %}
3. Click the **Confirm** button to save your changes.
{% endstep %}
{% endstepper %}
*This page is: Copyright © 2026 MariaDB. All rights reserved.*
{% @marketo/form formId="4316" %}