# Node and Operating System
The Node Dashboard pane provides detailed visibility into the health and performance of individual nodes that run MariaDB Server and MaxScale. It combines uptime, system capacity, operating system details, and hardware utilization with disk and network activity. This view helps administrators ensure each node has sufficient resources and can support the workloads running on it.
## Node Information
 Provides a high-level, at-a-glance summary of a specific server node's status, configuration, and capacity.
| Metric | Description |
| ------------------------- | ------------------------------------------------------------------------------------------------------------------------- |
| Node Uptime | Shows the total amount of time the server node has been running since its last restart. |
| Topology Info | Displays the node's current role or state within its database topology (e.g., Primary, Replica). |
| Node Allocatable Capacity | Details the compute resources allocated to the node, such as the number of CPU cores available. |
| Node Disk Capacity | Shows the total size of the key mounted filesystems, such as `/boot` and `/home`. |
| OS Info | Provides details about the node's OS, including architecture, distribution (e.g., `CentOS Stream 9`), and kernel release. |
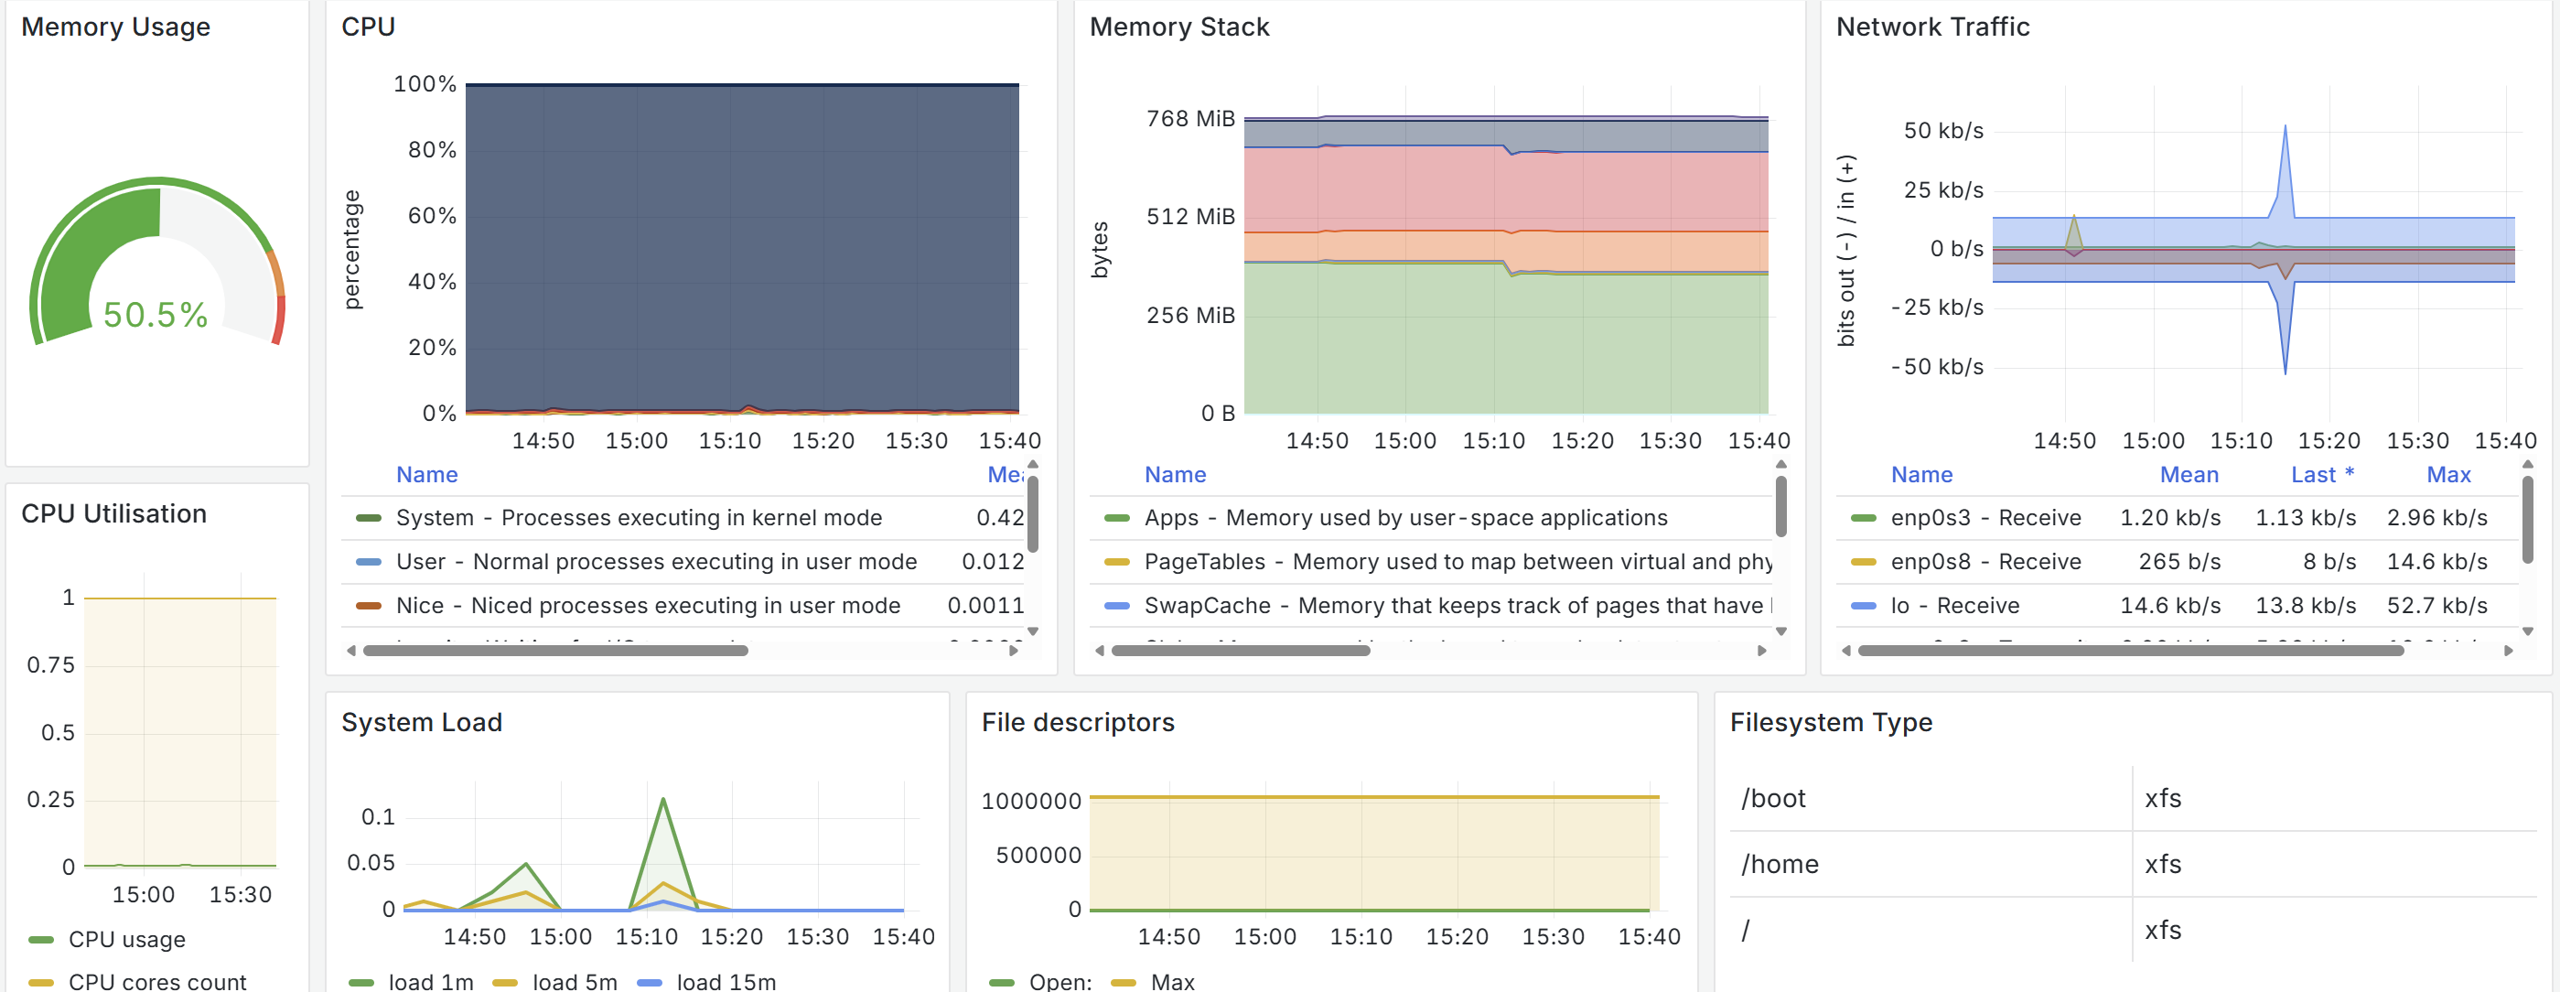
## Node System Information
 Tracks memory usage, CPU performance, system load, and resource consumption at the process level.
| Metric | Description |
| ---------------- | ----------------------------------------------------------------------------------- |
| Memory Usage | Percentage of physical memory in use. |
| CPU | Graph showing CPU usage distribution across user, system, idle, iowait, and kernel. |
| Memory Stack | Breakdown of memory allocation: applications, cache, buffers, swap, etc. |
| Network Traffic | Inbound and outbound network throughput per interface. |
| CPU Utilisation | Effective CPU usage and number of cores for the node. |
| System Load | Load averages for the last 1, 5, and 15 minutes. |
| File Descriptors | Current vs. maximum number of open file descriptors. |
| Filesystem Type | Table of filesystem types and mount points on the node. |
## Filesystem Section
 Monitors disk performance and utilization for the node’s storage devices.
| Metric | Description |
| ---------------- | -------------------------------------------------------------------- |
| Disk Throughput | Read and write throughput (bytes per second) per device. |
| Disk IOPS | Number of input/output operations per second for reads and writes. |
| Disk Utilisation | Percentage of time that disk devices are busy handling I/O requests. |
*This page is: Copyright © 2025 MariaDB. All rights reserved.*
{% @marketo/form formId="4316" %}


