Announcing SkySQL, Inc. – A Milestone Moment for SkySQL customers and the MariaDB Community. Read More

Trusted By Leading Global Enterprises


")
Why SkySQL?
MariaDB is one of the most popular, mature open source relational databases in the world.
SkySQL brings production-grade capabilities to MariaDB – Automate complex DB configuration, augment your DB with cloud native features like VPC/auto-scaling, replicate anywhere across the globe, manage data very securely with end-2-end encryption and compliance and much much more.
START SMALL, GO ANYWHERE
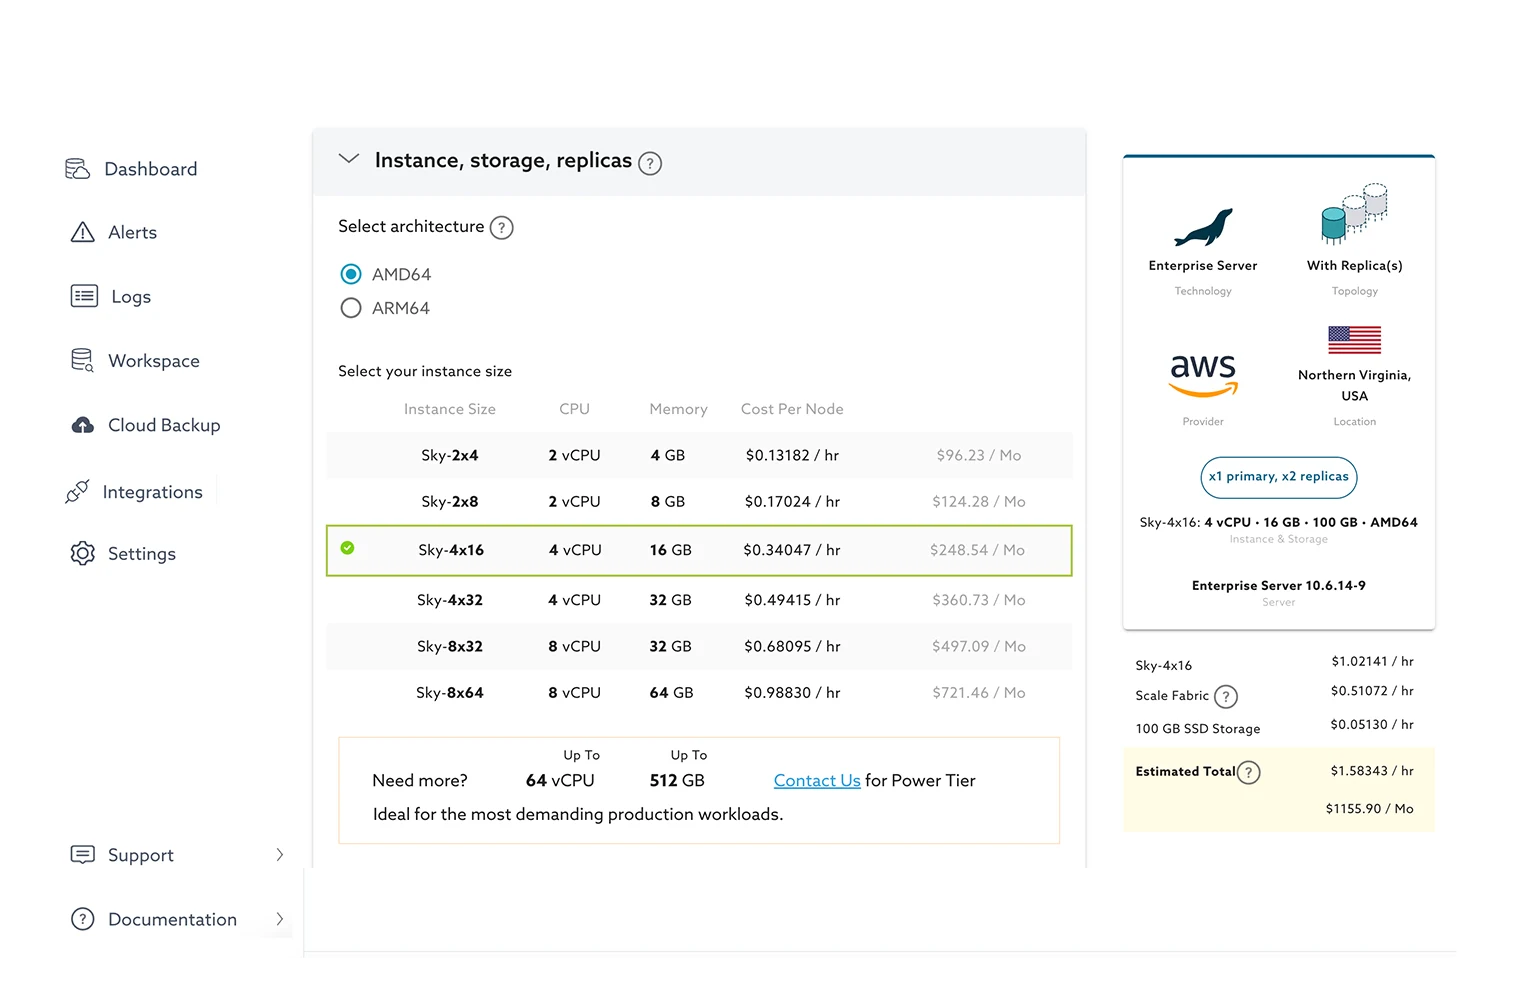
Developer-friendly, starting as low as $100 a month, with little initial need for IT support and built for global mission-critical applications. Easily scale across three dimensions:
AUTONOMOUS, INTELLIGENT SCALING
Take the complexity out of scaling operations with SkySQL. Easily expand your infrastructure using the SkySQL Portal or API, or simply enable automatic scaling with intelligent algorithms. With the ability to scale vertically or horizontally, your applications continue to run seamlessly while your resources adapt to meet changing demands.
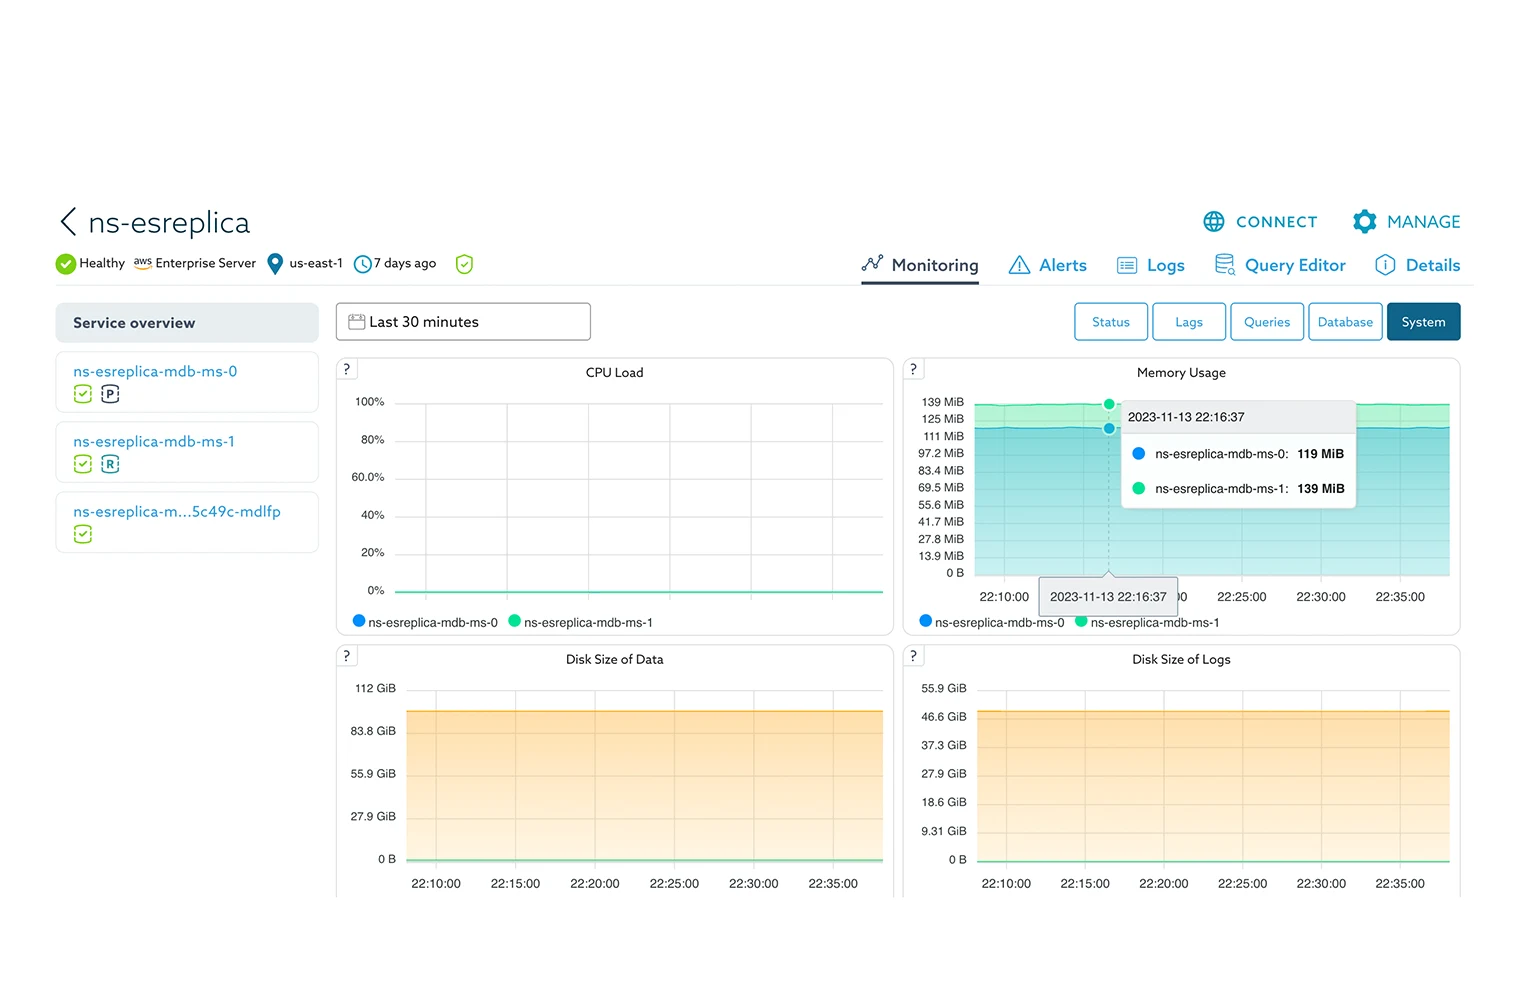
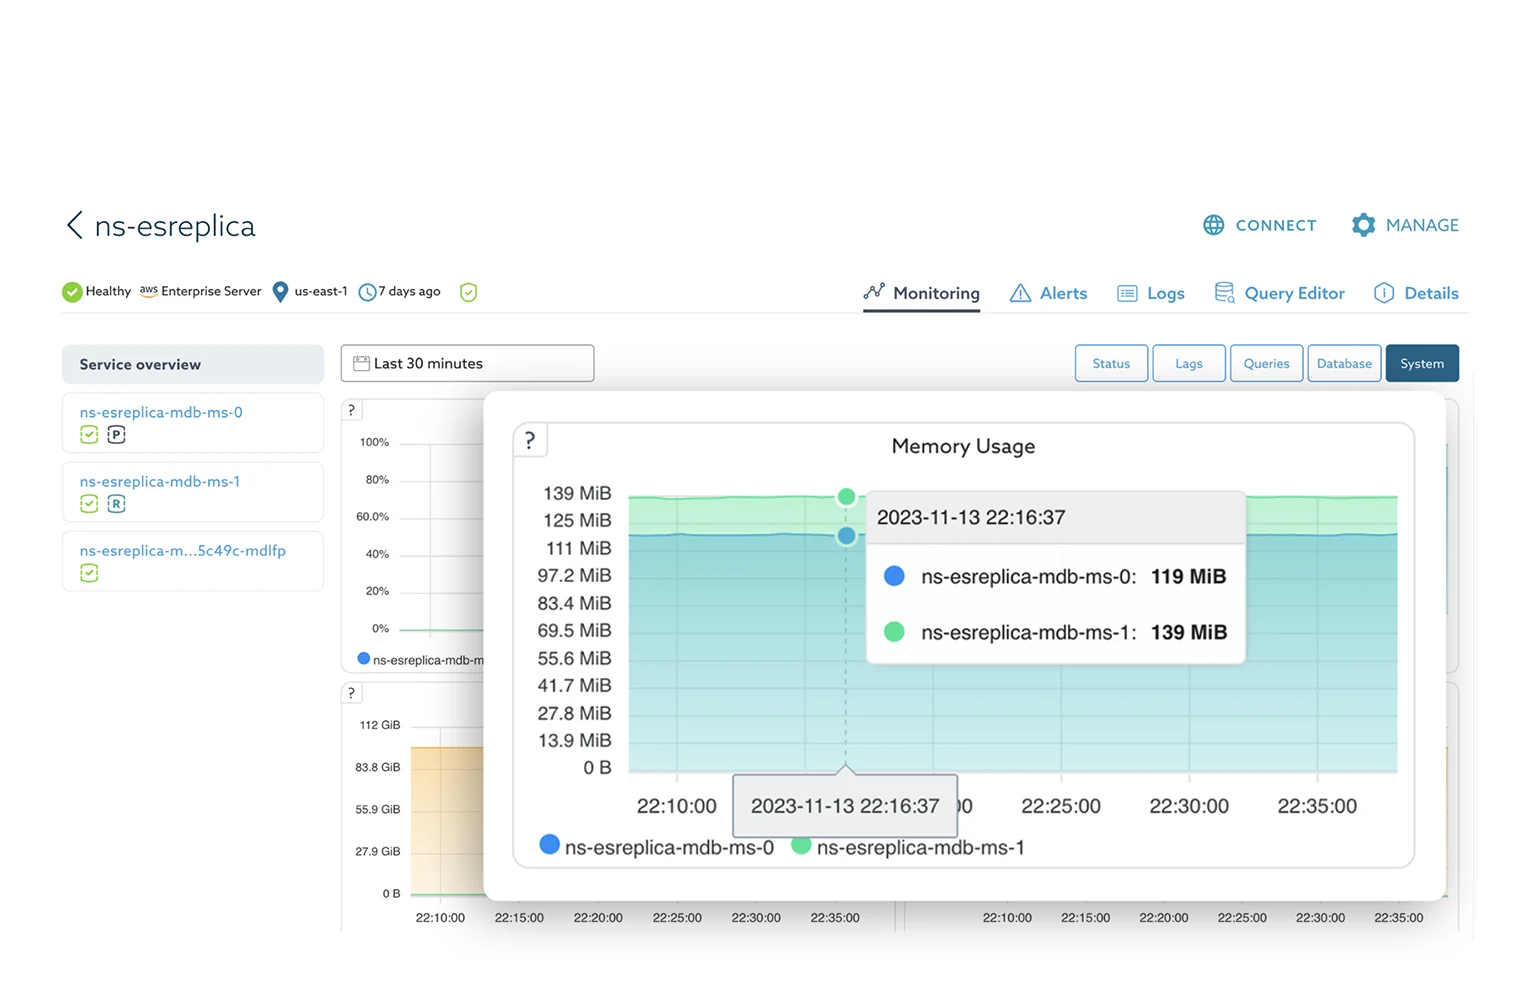
OBSERVE EVERYTHING, ANYWHERE
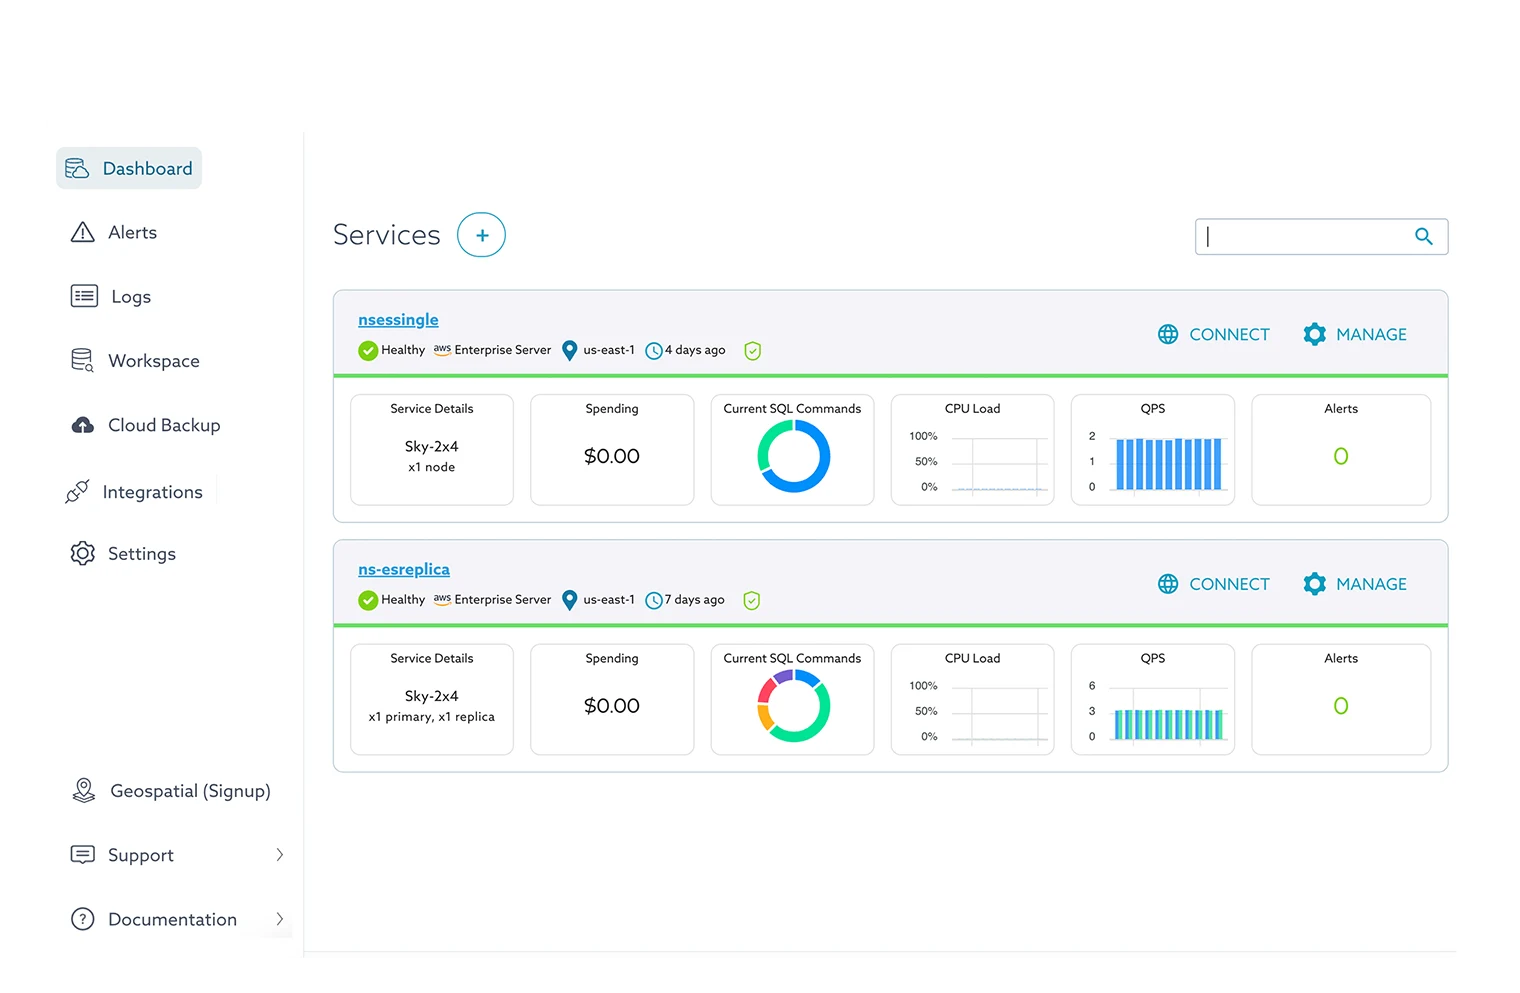
SkySQL Observability provides monitoring and management for all MariaDB databases managed by SkySQL across zones, regions and even cloud providers. No matter where your MariaDB database is running, SkySQL Observability enables users to pinpoint slow or failed queries, other performance issues and reduce response time with faster, more accurate insights.
ULTIMATE FLEXIBILITY FOR DEVELOPERS AND CLOUD OPS
SkySQL takes an API-first approach with a set of REST APIs compatible with MariaDB’s broad ecosystem of third-party development, integration and migration tool partners. SkySQL also provides built-in developer tools to support parsing and ingesting JSON and semi-structured data, as well as running SQL queries and visualizing results.
CONTINUOUSLY AVAILABLE
Facing Application outage with severed DB connections during failures? Or, a long failover time to an alternate server?
With our advanced proxy (maxscale) get near instant failover, with automatic transaction replays and keep things totally transparent to your application.

UNSTOPPABLE PERFORMANCE
Achieve 50% or better price-performance compared to AWS RDS on the simplest form factor – a single fully managed MariaDB server.

EXPERT MANAGEMENT – FRACTIONAL DBAS
No matter the size of a company, mission-critical projects need DBA expertise to handle the last mile of database tasks. SkyDBAs offer unparalleled expertise and value – beyond anything available from public clouds. Senior-level MariaDB certified DBAs are available 24×7 and function as virtual members of your team, performing all database operations like a full-time employee, at a fraction of the cost.

DISASTER RECOVERY
SkySQL combines nightly backups, persistent disks, point-in-time rollback and cross-region replication to minimize the recovery point and recovery time objectives (RPO/RTO) of mission-critical, production databases.

ENTERPRISE GRADE SECURITY
SkySQL databases are secure by default, with end-to-end encryption and all database access restricted until administrators allow specific clients and servers. Power tier users run with total isolation in their own VPC and Kubernetes cluster. Users can turn ON enterprise Audit features. MariaDB’s Trust Center provides detailed information on SkySQL security policies and procedures as well as ISO 27001 and SOC 2 certifications, HIPAA practices and GDPR compliance.

How do we compare?
Comparing Resilience, Scalability, Smart Automation, and Monitoring Across Architectures and Workloads
| AWS RDS MARIADB | AWS AURORA | GOOGLE CLOUD SQL | SKYSQL | |
|---|---|---|---|---|
| Database | MariaDB Community | MySQL interface | MySQL Community | MariaDB Enterprise & Community |
| Multi-cloud | ||||
| Complete Resource Isolation (Dedicated Kubernetes Clusters) | ||||
| Expert DBAs (at a fractional price) | ||||
| Built-in NoSQL API support | ||||
| Built-in query editor | Query Editor | |||
| Failover target | Hot standby | Hot standby | Hot standby | Active |
| Automatic failover | DNS-based (slow) | DNS-based (slow) | DNS-based (slow) | Yes (sub-sec) |
| Transaction replay | ||||
| Read/write splitting | Yes (MaxScale) | |||
| Self-service: scale up/down instances | ||||
| Self-service: scale out/in replicas | ||||
| Autonomous: scale up/down instances | ||||
| Autonomous: scale out/in replicas | Hot standby | Hot standby | ||
| Autonomous: scale up storage | ||||
| Built-in comprehensive monitoring |
