> For the complete documentation index, see [llms.txt](https://mariadb.com/docs/llms.txt). Markdown versions of documentation pages are available by appending `.md` to page URLs; this page is available as [Markdown](https://mariadb.com/docs/tools/enterprise/mariadb-enterprise-manager/usage/database-fleet-overview.md).
# Database Fleet Overview
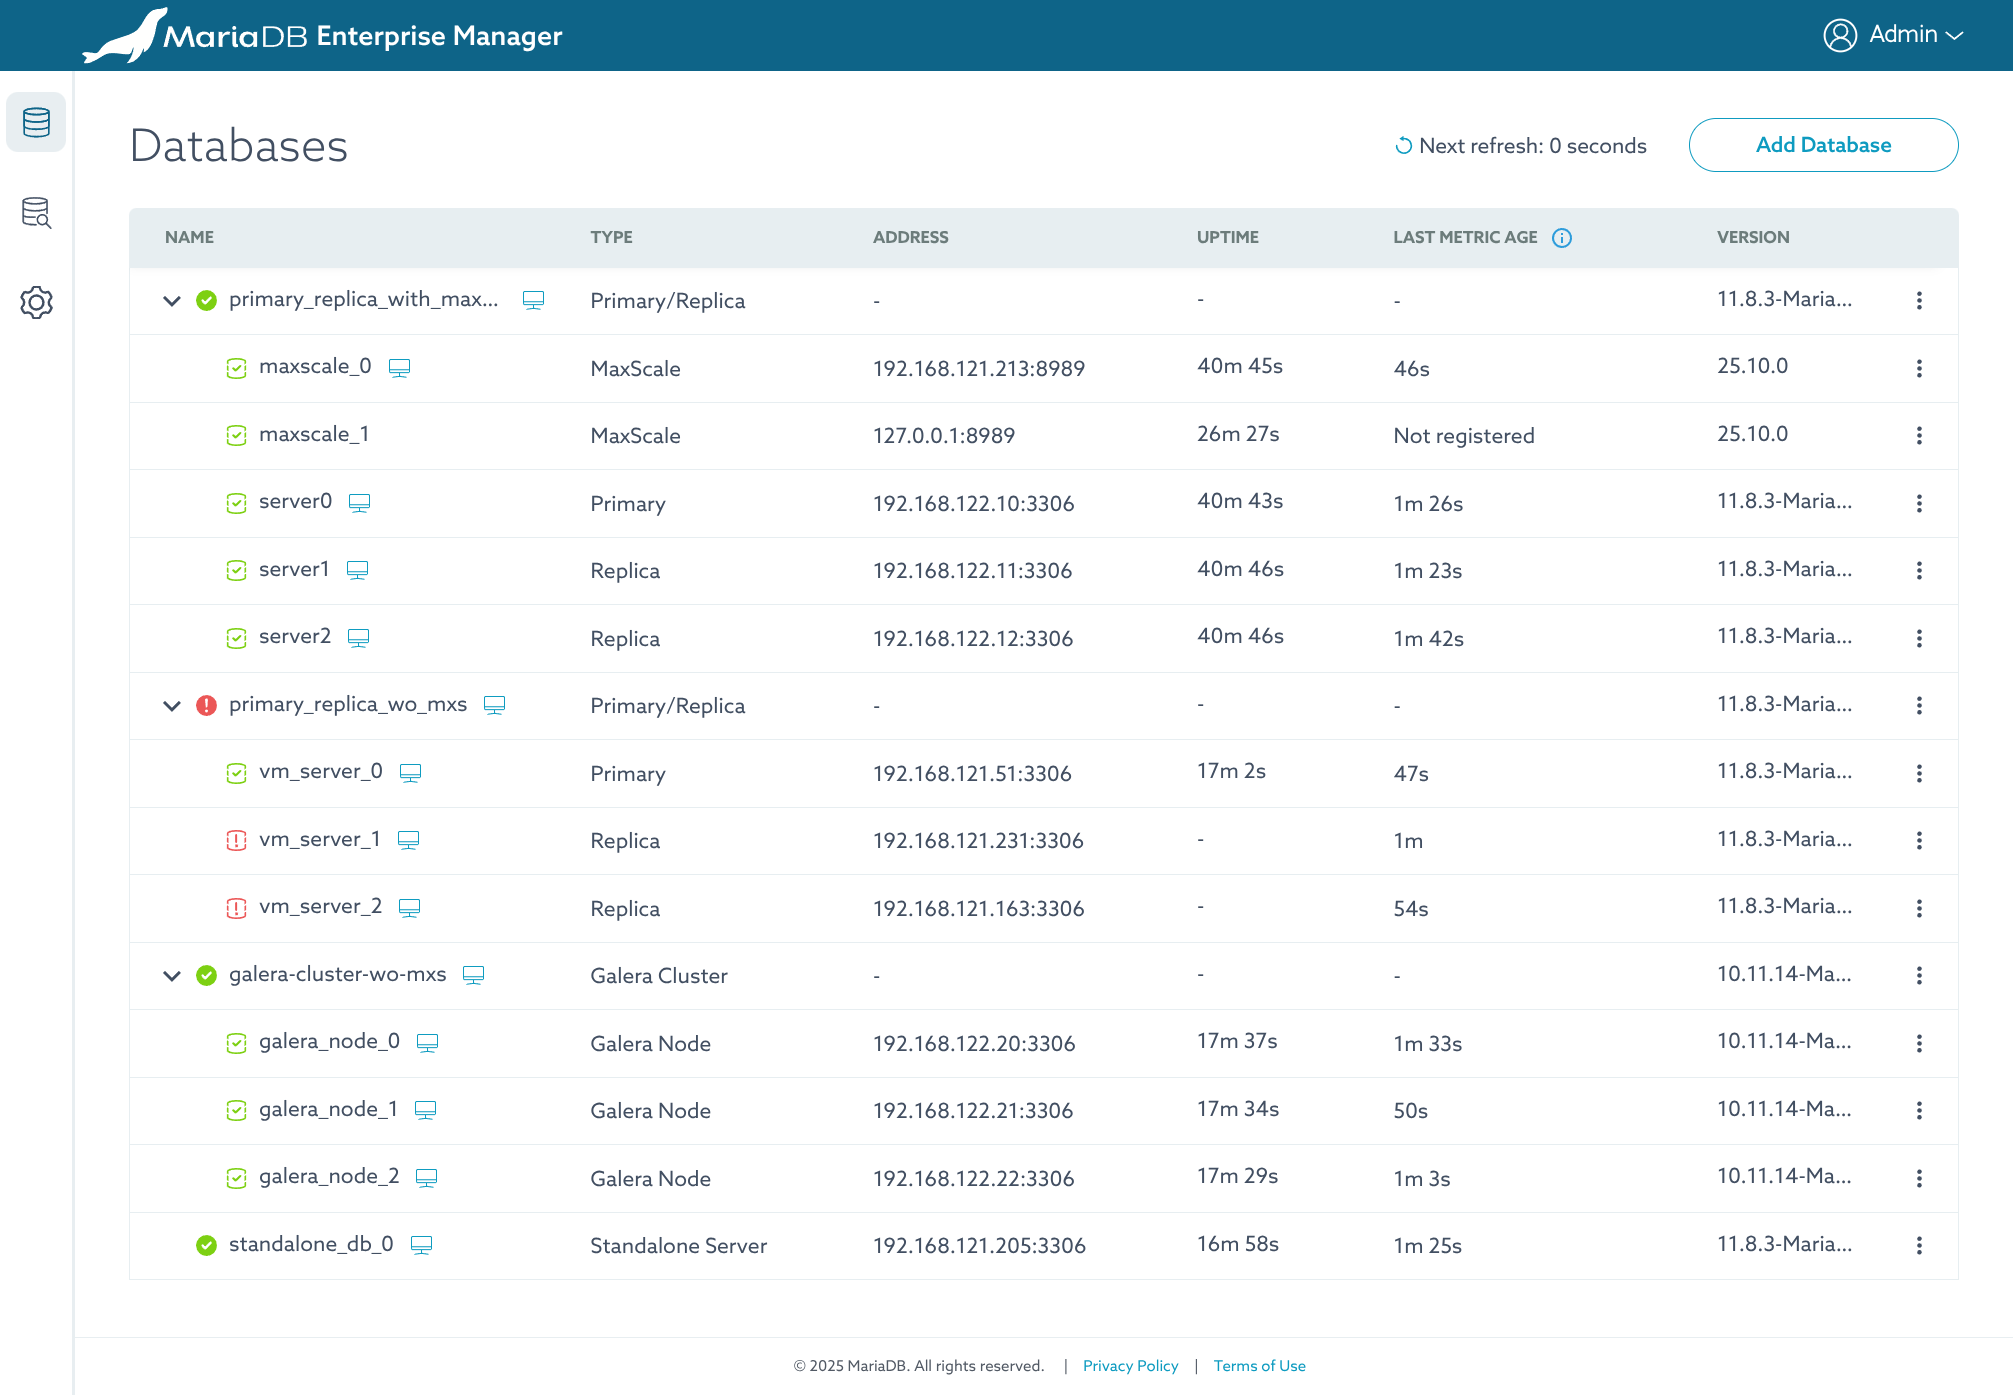
The Databases list in Enterprise Manager: an aggregated view of all monitored topologies with their health, type, metric age, and the actions available on each database and node.
The **Databases** list is the central inventory for all your monitored database topologies. It provides a hierarchical, at-a-glance overview of the health, status, and configuration of your entire database environment.
 ## Understanding the Columns
### **NAME Column**
This column displays the logical names of your databases and the individual server nodes within each topology. It also contains important status and quick-access icons.
#### **Status Icons**
| Icon | Applies To | Meaning |
| -------- | ------------------------------------- | ------------------------------------------------------------------------------------------------ |
| 🟢 Green | Aggregated Topology, Server, MaxScale | The component and all its members are running correctly. |
| 🔴 Red | Aggregated Topology, Server, MaxScale | One or more members in the topology are down or not functioning properly. |
| ⚫ Gray | Server | The server's status is unknown. This typically happens if the MaxScale node managing it is down. |
{% hint style="info" %}
**Quick-Access Icons**
This icon (
## Understanding the Columns
### **NAME Column**
This column displays the logical names of your databases and the individual server nodes within each topology. It also contains important status and quick-access icons.
#### **Status Icons**
| Icon | Applies To | Meaning |
| -------- | ------------------------------------- | ------------------------------------------------------------------------------------------------ |
| 🟢 Green | Aggregated Topology, Server, MaxScale | The component and all its members are running correctly. |
| 🔴 Red | Aggregated Topology, Server, MaxScale | One or more members in the topology are down or not functioning properly. |
| ⚫ Gray | Server | The server's status is unknown. This typically happens if the MaxScale node managing it is down. |
{% hint style="info" %}
**Quick-Access Icons**
This icon ( ) is a shortcut that takes you directly to the detailed Grafana monitoring dashboard for that specific node or topology.
{% endhint %}
### **TYPE Column**
This column shows the role of each node as automatically detected by Enterprise Manager (e.g., `Primary`, `Replica`, `MaxScale`, `Galera Node`, `Standalone Server`).
{% hint style="warning" %}
If this column shows `'-'`, it indicates an issue. For instance, in a Primary/Replica topology, a server expected to be a `Replica` that shows `'-'` is likely not replicating correctly from the primary.
{% endhint %}
### **LAST METRIC AGE Column**
This column shows the time elapsed since the agent on that node last reported metrics.
{% hint style="danger" %}
If the age is 5 minutes or greater, it indicates a problem. Verify that the `mema-agent` is installed, running, and can communicate with the Enterprise Manager server on that host.
{% endhint %}
## Interacting with Your Databases
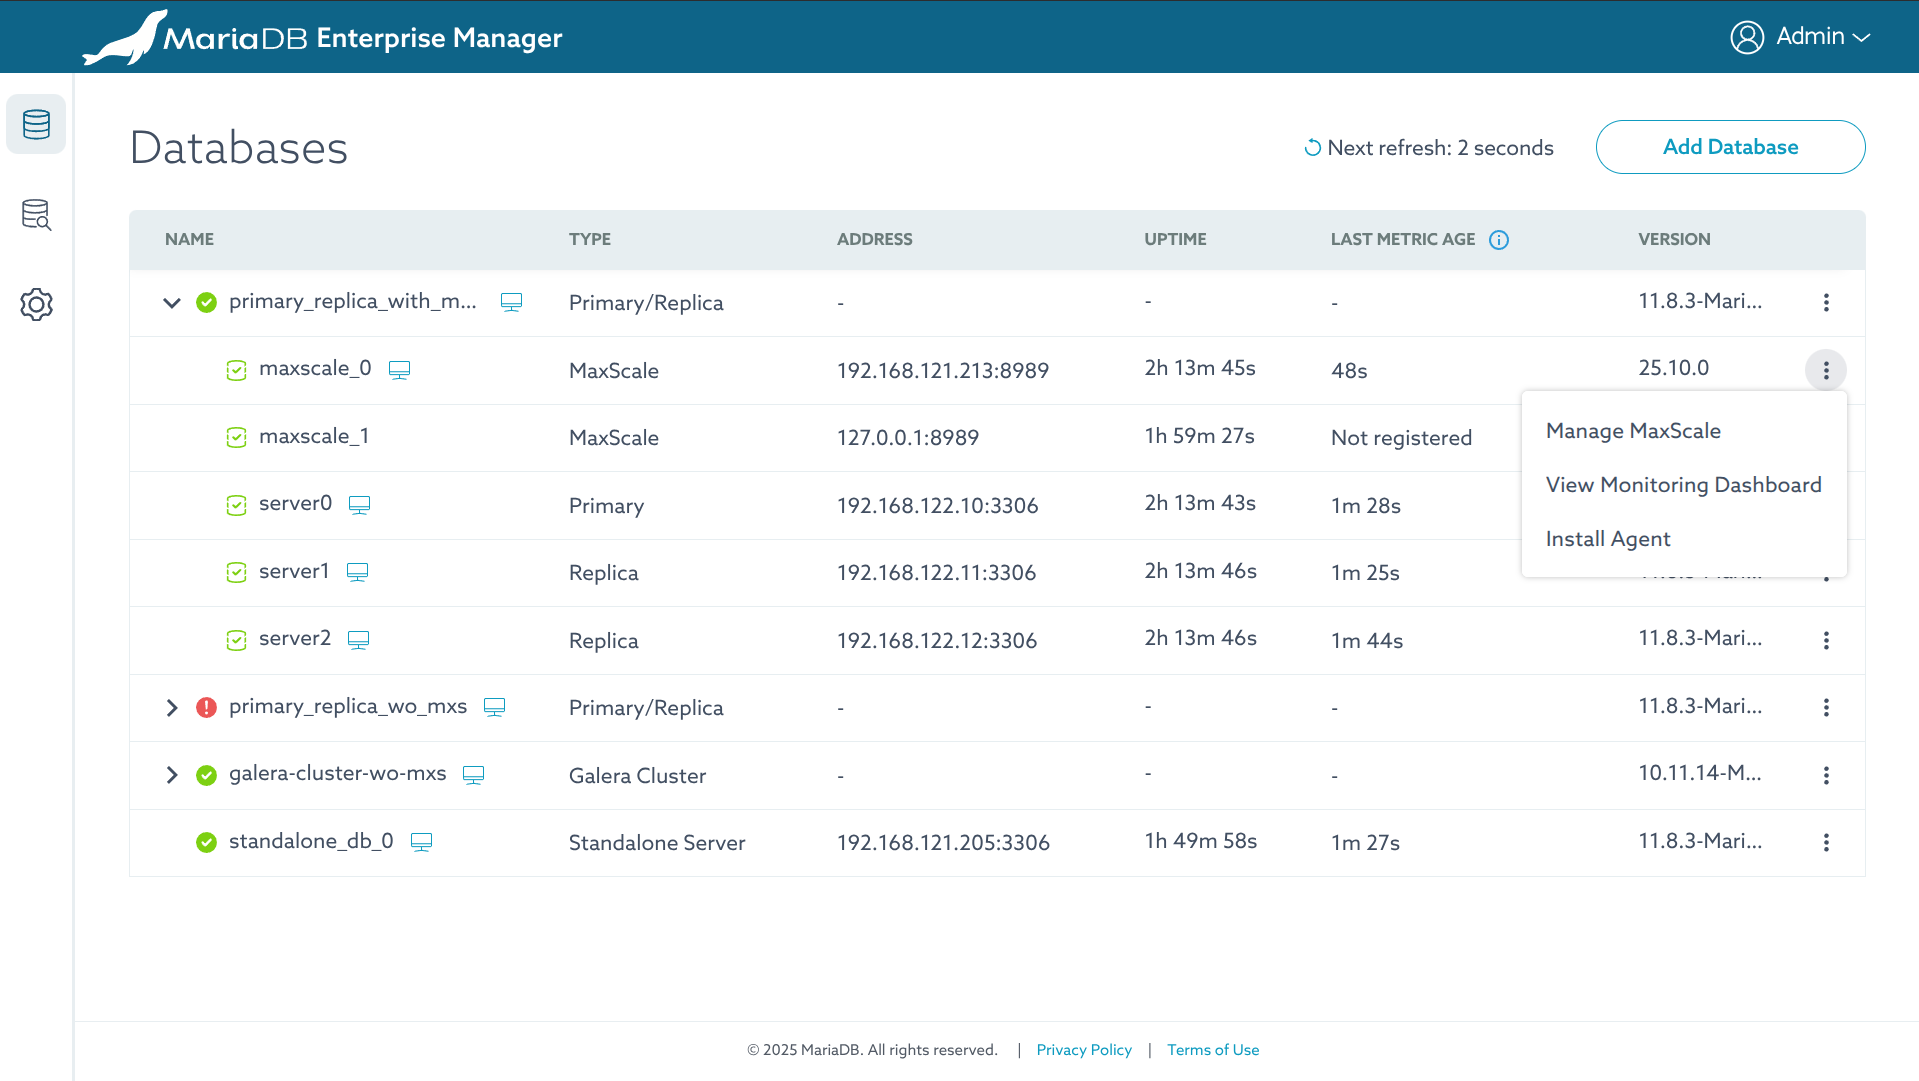
You can perform actions on your databases and nodes using the three-dot menu (⋮) on the far right of each row.
) is a shortcut that takes you directly to the detailed Grafana monitoring dashboard for that specific node or topology.
{% endhint %}
### **TYPE Column**
This column shows the role of each node as automatically detected by Enterprise Manager (e.g., `Primary`, `Replica`, `MaxScale`, `Galera Node`, `Standalone Server`).
{% hint style="warning" %}
If this column shows `'-'`, it indicates an issue. For instance, in a Primary/Replica topology, a server expected to be a `Replica` that shows `'-'` is likely not replicating correctly from the primary.
{% endhint %}
### **LAST METRIC AGE Column**
This column shows the time elapsed since the agent on that node last reported metrics.
{% hint style="danger" %}
If the age is 5 minutes or greater, it indicates a problem. Verify that the `mema-agent` is installed, running, and can communicate with the Enterprise Manager server on that host.
{% endhint %}
## Interacting with Your Databases
You can perform actions on your databases and nodes using the three-dot menu (⋮) on the far right of each row.
 {% stepper %}
{% step %}
**Accessing the MaxScale GUI**
* Click the three-dot menu (⋮) next to a MaxScale node.
* Select "Manage MaxScale".
{% endstep %}
{% step %}
**Configuring SSO in `maxscale.cnf`**
To enable SSO, add the following parameters to your MaxScale configuration file (`maxscale.cnf`) on the MaxScale host:
```ini
[maxscale]
# ... other settings ...
admin_host=0.0.0.0
admin_oidc_url=https://:8090
admin_oidc_client_id=admin
admin_oidc_client_secret=mariadb
admin_oidc_ssl_insecure=true
```
| Parameter | Description |
| -------------------------- | -------------------------------------------------------------------------------- |
| `admin_oidc_url` | URL for Enterprise Manager server that includes hostname or IP address and port. |
| `admin_host` | Must be set to `0.0.0.0` to allow external connections from Enterprise Manager. |
| `admin_oidc_client_id` | Default credentials used by Enterprise Manager to request the access token. |
| `admin_oidc_client_secret` | Default credentials used by Enterprise Manager to request the access token. |
| `admin_oidc_ssl_insecure` | Skip TLS certificate verification in case certificates aren't configured |
| {% endstep %} | |
| {% endstepper %} | |
*This page is: Copyright © 2026 MariaDB. All rights reserved.*
{% @marketo/form formId="4316" %}
{% stepper %}
{% step %}
**Accessing the MaxScale GUI**
* Click the three-dot menu (⋮) next to a MaxScale node.
* Select "Manage MaxScale".
{% endstep %}
{% step %}
**Configuring SSO in `maxscale.cnf`**
To enable SSO, add the following parameters to your MaxScale configuration file (`maxscale.cnf`) on the MaxScale host:
```ini
[maxscale]
# ... other settings ...
admin_host=0.0.0.0
admin_oidc_url=https://:8090
admin_oidc_client_id=admin
admin_oidc_client_secret=mariadb
admin_oidc_ssl_insecure=true
```
| Parameter | Description |
| -------------------------- | -------------------------------------------------------------------------------- |
| `admin_oidc_url` | URL for Enterprise Manager server that includes hostname or IP address and port. |
| `admin_host` | Must be set to `0.0.0.0` to allow external connections from Enterprise Manager. |
| `admin_oidc_client_id` | Default credentials used by Enterprise Manager to request the access token. |
| `admin_oidc_client_secret` | Default credentials used by Enterprise Manager to request the access token. |
| `admin_oidc_ssl_insecure` | Skip TLS certificate verification in case certificates aren't configured |
| {% endstep %} | |
| {% endstepper %} | |
*This page is: Copyright © 2026 MariaDB. All rights reserved.*
{% @marketo/form formId="4316" %}