# MariaDB MaxScale
This dashboard shows MaxScale’s health and load, how backend servers are seen by each MaxScale, and the traffic/query volume flowing through it—plus cache efficiency from the Query Classifier.
### **Topology Overview**
Provides a visual representation of the entire system's architecture and connectivity.
 | Section | Description |
| ------------------------------- | ------------------------------------------------------------------------------------------------------------------------------------------------------------------------------------------------------- |
| **Project** | Displays the currently selected project label. |
| **Name** | Shows the selected database/topology name. |
| **Version** | Shows MaxScale version. |
| **Topology Info** | Count of nodes grouped by type (e.g., server, MaxScale). |
| **Backend Server States** | Timeline of each backend server’s role and health as seen by each MaxScale. Values are color-mapped to: Read, Write, Up, Down. Use this to spot failovers, read/write role flips, or outages over time. |
| **Maxscale Uptime by Instance** | Uptime in seconds for each MaxScale instance. |
### System Metrics
**System Metrics** provide comprehensive insights into the performance and health of individual system resources.
 | Metric | Description |
| ------------------- | -------------------------------------------------------------------------------------------------------------------------------- |
| **CPU Utilisation** | Effective CPU usage (%) per instance, excluding idle/iowait/guest time. |
| **Memory Usage** | Working memory in use (%) per instance (total minus free/buffers/cache/slab). |
| **Network Traffic** | Per-interface throughput (bits/s). Transmit is plotted below the axis (negative-Y), receive above—making direction easy to read. |
### MaxScale Metrics
**Query Classifier Cache Metrics** help in analyzing and optimizing query routing efficiency by tracking cache hits/misses and monitoring cache size.
 | Metric | Description |
| ------------------------ | ------------------------------------------------------------------------------------------------------- |
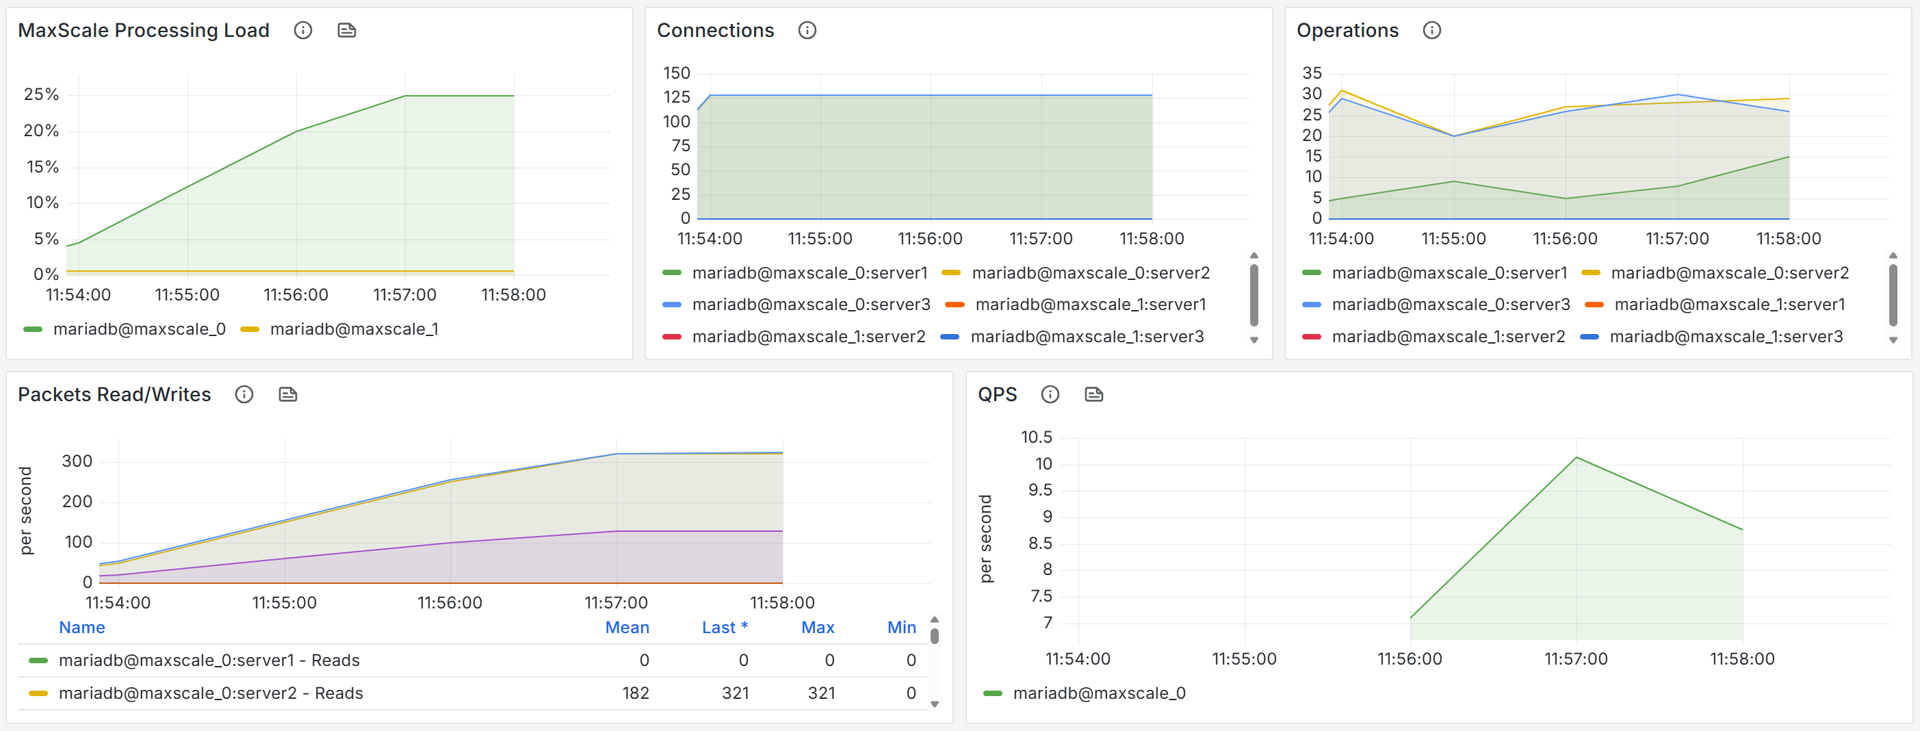
| MaxScale Processing Load | Percentage of total CPU time consumed by the MaxScale process over time (a direct view of router load). |
| Connections | Active backend connections per server as observed by MaxScale. |
| Operations | Active operations per backend server (ongoing requests tracked by MaxScale). |
| Packets Read/Writes | Per-server packet read and write rates (packets/s). Useful for spotting uneven load distribution. |
| QPS | Queries per second passing through MaxScale across the selected instances (overall routing throughput). |
### Query Classifier Cache Metrics
Evaluate query routing efficiency by tracking and optimizing cache metrics like hits, misses, and cache size.
 | Metric | Description |
| ------------------------ | ----------------------------------------------------------------------------------------------------------- |
| **Cache Hits vs Misses** | Per-second hits and misses in the Query Classifier cache. Analyze the relationship to assess effectiveness. |
| **Cache Size** | Current size of the Query Classifier cache (bytes). Monitor growth with Hits/Misses for tuning insights. |
*This page is: Copyright © 2025 MariaDB. All rights reserved.*
{% @marketo/form formId="4316" %}


