
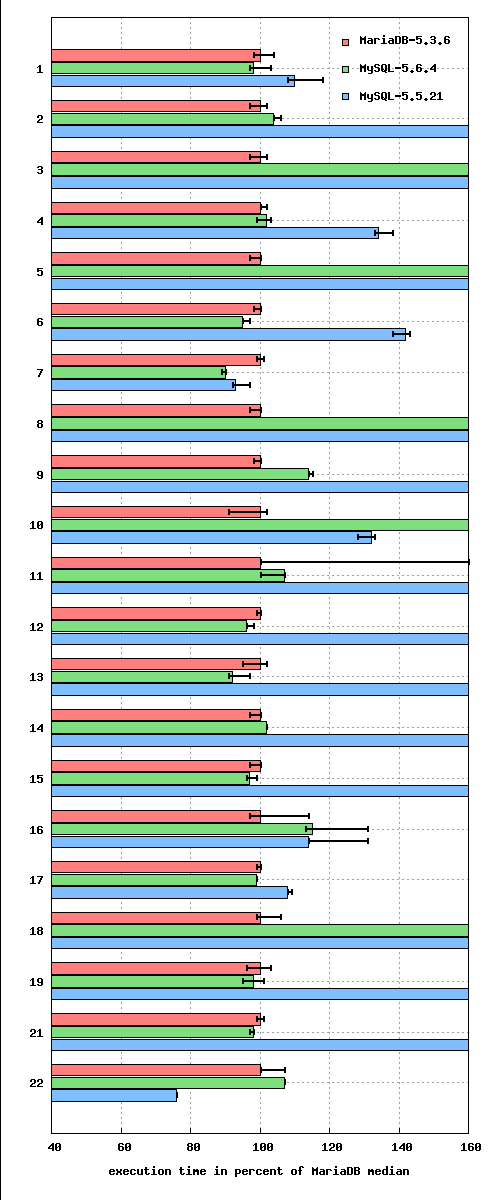
When I published the MariaDB-5.3.4 sysbench results I said “if your workload includes complex (sub)queries, then you will probably benefit more from MariaDBs new optimizer features”. Today I will present some benchmark results for complex workload. The benchmark is DBT3, an implementation of the TPC-H specification. DBT3 is written in C and hosted at Sourceforge. The DBT3 benchmark can run at different scale factors – defining the size of the database. I used a scale factor of 30 which yields ~30GB of raw data and ~48GB of disk footprint. The machine running the benchmark had 16G of memory. InnoDB has the problem of fluctuating table statistics, leading to rather unpredictable query plans. For this reason the benchmark tables were created with the MyISAM engine. I will definitely run this benchmark vs. InnoDB in the future, but this requires some changes in our DBT3 automation scripts. Both MySQL and MariaDB had to be tuned to use the new optimizer features. Specifically I turned on multi-range-read and batched-key-access. The MRR cost estimation was turned off because it’s not production ready in neither MySQL-5.6 nor MariaDB. For details seethe tarball with the configuration files. The following concentrates on the DBT3 Power Test which consists of 22 rather heavy JOIN queries. Each query was run 5 times on cold caches (server restart + file system cache cleared). Query execution time was limited by a 2 hour timeout. Execution time varies between 10 seconds and >2000 seconds, so for the following picture the execution time was normalized (MariaDB = 100%). The colored bar shows the median and the whiskers show min and max:

Here we can already see that MySQL-5.5 cannot cope well with this type of load. MySQL-5.6 has improved on many queries, but then again for query 3 or 8 it is even worse than 5.5. Rather a mystery is query 22 where MySQL 5.5 comes in first. For more details, here is a table with the numbers. I have colored the rows to mark the winner (same colors as the diagram). If the difference is below 5% then it’s a draw. Those lines are not colored.
| MariaDB-5.3.5 | MySQL-5.6.4 | MySQL-5.5.21 | |||
|---|---|---|---|---|---|
| Query | Seconds | Seconds | relative | Seconds | relative |
| 1 | 289 | 286 | -1.04% | 319 | +10.38% |
| 2 | 46 | 48 | +4.35% | 490 | +965.2% |
| 3 | 243 | 1322 | +444% | 534 | +119.7% |
| 4 | 138 | 141 | +2.17% | 185 | +34.06% |
| 5 | 187 | 1232 | +558.8% | >7200 | |
| 6 | 199 | 191 | -4.02% | 284 | +42.71% |
| 7 | 861 | 777 | -9.76% | 803 | -6.74% |
| 8 | 288 | 1628 | +465.3% | 742 | +157.6% |
| 9 | 268 | 307 | +14.55% | >7200 | |
| 10 | 818 | 1504 | +83.86% | 1083 | +32.40% |
| 11 | 13 | 14 | +7.69% | 342 | +2531% |
| 12 | 213 | 206 | -3.29% | 452 | +112.2% |
| 13 | 250 | 230 | -8.00% | 1576 | +530.4% |
| 14 | 90 | 92 | +2.22% | >7200 | |
| 15 | 194 | 190 | -2.06% | 401 | +106.7% |
| 16 | 129 | 149 | +15.50% | 148 | +14.73% |
| 17 | 800 | 797 | -0.38% | 867 | +8.38% |
| 18 | 284 | >7200 | >7200 | ||
| 19 | 62 | 61 | -1.61% | 2013 | +3147% |
| 20 | >7200 | >7200 | >7200 | ||
| 21 | 185 | 182 | -1.62% | >7200 | |
| 22 | 13 | 14 | +7.69% | 10 | -23.08% |
Query 11 is a draw because the difference is only 1 second (the granularity of time measurement). Query 11 showed a strange phenomenon for MariaDB: the first run took 43 seconds, subsequent runs only 13 seconds. This is probably a caching effect of the disk controller. Neither MySQL version finishes query 18 within the time limit. None of the 3 candidates finishes query 20 within the limit. Query execution plans differed between the candidates. Sometimes I could tweak the results by forcing the known good join order (using straight_join). I.e. on query 7 MariaDB used a different join order. When I forced the MySQL plan, then MariaDB needed only ~70% of the MySQL time. Or for query 12 MySQL 5.5 used a different plan as the others. After forcing the better join order, all 3 came it at the same time. Finally I have another diagram, this time showing the details for the region around 100%.
If you want to run the DBT3 benchmark on your own, then you can use our DBT3 scripts. I have tarred up the configuration files for those scripts and the extracted raw data for download here.