

Key takeaways
- More Transactions per Second With one node of a 3-node cluster at 80 ms round-trip time (RTT), Raft Cluster sustained about 2,150 transactions per second (TPS) when writing to the leader. Galera Cluster sustained about 125 TPS, about 17 times less.
- Higher Peak Throughput On a write-only workload with 7 nodes, Raft Cluster reached 9,714 peak TPS on the leader against 6,587 TPS for Galera Cluster, 47.5% more.
- Faster Writes On a 3-node cluster with uniform low latency, the results were close: Galera Cluster was about 2% faster with no added latency and up to 4.9% faster on some other workloads, while Raft Cluster was 11.2% faster on a write-only workload when writing to the leader.
A clustered database has to keep its nodes in agreement without letting the slowest node set the pace for everyone else. MariaDB Galera Cluster does this by having every node process every write before it commits. MariaDB Raft Cluster, available in MariaDB Enterprise Server 12.3, commits a write once a majority of nodes have it.
This post compares the two in the situations where that difference should show up: one node with higher network latency, and clusters with more than three nodes. For how Raft Cluster works, see our overview post, MariaDB Raft Cluster: Consistency Without Waiting on Your Slowest Node.
Where to send writes in Raft Cluster
You can write to any node in a Raft Cluster, the leader or a follower. A write sent to a follower is forwarded to the leader, which replicates it and commits once a majority of nodes have it. The extra hop costs throughput: in our write-only tests, writing to a follower gave 0.5% to 20.5% less throughput than writing to the leader, depending on cluster size. Where you can choose, write to the leader. MariaDB MaxScale 25.10.2 and later can route writes to the leader automatically.
| MariaDB Galera Cluster | MariaDB Raft Cluster | |
| Replication model | Virtually synchronous, multi-primary (wsrep) | Leader-based consensus (Raft) |
| Where writes go | Any node | Any node; writes sent to a follower are forwarded to the leader. The leader is the recommended target. |
| Commit rule | Every node must process the transaction | A majority of nodes must have it (2 of 3, 3 of 5, 4 of 7) |
| When a node falls behind | Flow control pauses replication across the cluster once the node’s queue passes gcs.fc_limit | The leader throttles the cluster to a reduced write rate, set by raft_flow_control_drift_limit; writes do not stop |
Test environment
- MariaDB Enterprise Server 12.3, with Galera 4 or Raft 1.0 as the cluster provider.
- Google Cloud n2-standard-16 VMs (16 vCPU, 64 GB RAM), each with a 240 GB pd-ssd data volume. A collocated placement policy kept the baseline latency between nodes minimal.
- Network latency between nodes was added with the Linux tc tool and its netem filter. The delay is split between the two directions, so a 10 ms RTT means 5 ms added each way.
- Load was generated with sysbench.
Scenario A: one slow node
In cloud environments, a latency spike or cross-zone network jitter on a single node is common. This test shows whether one degraded node slows the whole cluster.
Setup
- Cluster: 3 nodes, two close together and one far away.
- Workload: sysbench oltp_read_write with 100% read-write transactions and 12 client threads.
- Latency: added between node 3 and the other two nodes, at 0 ms (a uniform LAN), 10, 20, 40 and 80 ms RTT.
- Load was applied to node 1, which is the leader in Raft.
Results
| RTT to node 3 | Galera (TPS) | Raft, leader (TPS) | Raft vs. Galera |
| 0 ms (LAN) | ~2,220 | ~2,180 | 0.98x |
| 10 ms | ~790 | ~2,150 | 2.7x |
| 20 ms | ~340 | ~2,150 | 6.3x |
| 40 ms | ~215 | ~2,150 | 10x |
| 80 ms | ~125 | ~2,150 | 17x |
Higher is better. Raft vs. Galera is Raft’s throughput divided by Galera’s at the same latency. Figures are rounded.
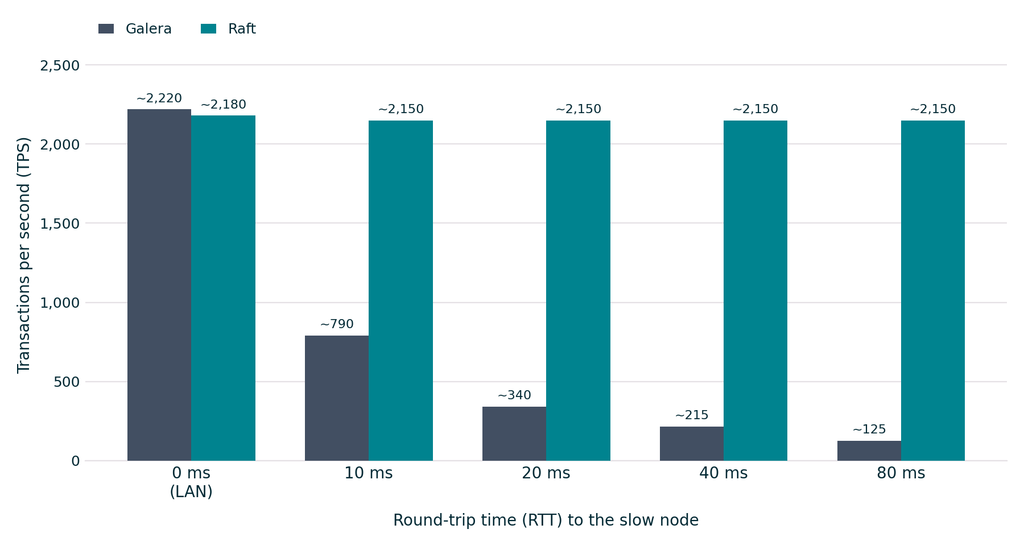
Figure 1. Throughput by round-trip time to the slow node, 3-node cluster.
What the numbers show
- Galera’s throughput follows the slow node. A Galera transaction commits only after every node has processed it, so the round-trip time to node 3 is added to every commit. Throughput fell from about 2,220 TPS with no added latency to about 125 TPS at 80 ms RTT, a drop of 94%.
- Raft’s throughput barely moves. Raft commits once a majority has the write, which is 2 of 3 nodes here, so node 3 is not on the commit path. Leader throughput stayed between about 2,150 and 2,180 TPS at every latency level, which is 2.7 times Galera’s throughput at 10 ms and 17 times at 80 ms.
- On a uniform LAN, the two were close. With no added latency Galera reached about 2,220 TPS and Raft about 2,180 TPS, so Raft was about 2% behind.
Scenario B: more nodes
Adding nodes raises fault tolerance: a 5-node cluster survives two simultaneous node failures and a 7-node cluster survives three. The question is what it costs in write throughput.
Setup
- Clusters: 3, 5 and 7 nodes on Google Cloud, with uniform low latency between nodes.
- Workload: sysbench oltp_write_only.
- Targets: Galera and Raft. Load was applied to the first node (the leader in Raft) or, for the Raft follower figures, to the second node. Galera has no leader or follower, so its figures are for load on the first node. All figures are peak TPS.
Results
| Cluster size | Galera (peak TPS) | Raft, leader (peak TPS) | Raft, follower (peak TPS) | Leader vs. Galera | Follower vs. Galera |
| 3 nodes | 11,564 | 12,863 | 11,314 | +11.2% | -2.2% |
| 5 nodes | 10,008 | 13,674 | 10,872 | +36.6% | +8.6% |
| 7 nodes | 6,587 | 9,714 | 9,666 | +47.5% | +46.7% |
Higher is better. Percentages compare each Raft figure with the Galera figure at the same cluster size; a negative value means Galera was faster.
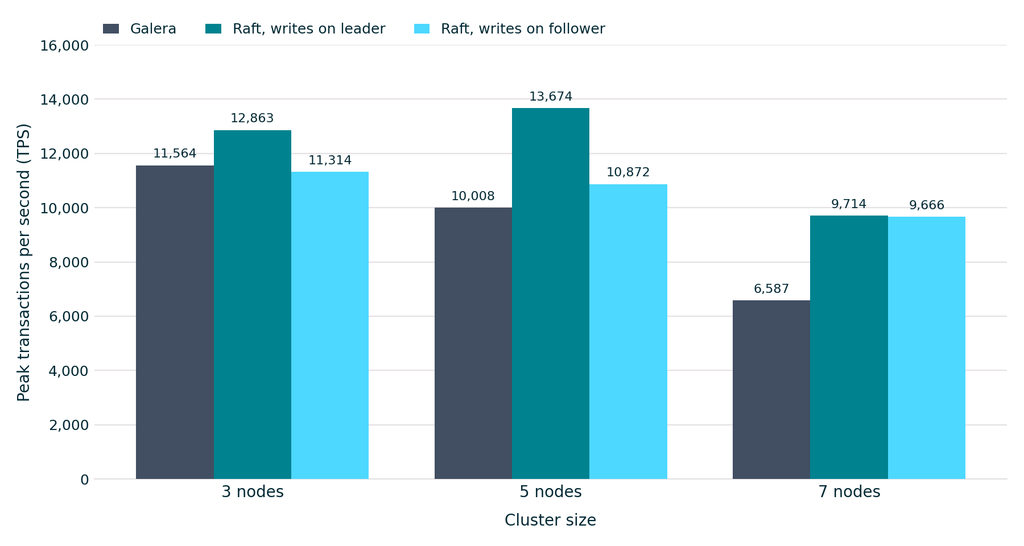
Figure 2. Peak write-only throughput by cluster size.
What the numbers show
- Galera’s write throughput fell with every node added. From 3 to 7 nodes it dropped from 11,564 to 6,587 TPS, a loss of 43.0%. Each additional node is one more participant that has to process every write before it commits.
- Raft’s write throughput held up better. Leader throughput peaked at 13,674 TPS with 5 nodes and was 9,714 TPS with 7 nodes, 24.5% below its 3-node figure of 12,863 TPS. At 7 nodes that is 47.5% more than Galera.
- Follower writes stay ahead of Galera from 5 nodes on. At 5 nodes, Raft delivered 10,872 TPS through a follower, 8.6% more than Galera, and at 7 nodes 9,666 TPS, 46.7% more. At 3 nodes, follower writes were 2.2% behind Galera.
- Results depend on the workload. We tested a variety of workloads and thread counts. The impact of latency or a larger cluster was in general bigger for workloads with more writes.
Which one to choose
Galera Cluster fits a 3-node cluster on a uniform, low-latency network. It was about 2% faster with no added latency and up to 4.9% faster on some other workloads in our 3-node tests, and it accepts writes on every node without forwarding.
Raft Cluster fits deployments where node latency is not uniform, such as nodes spread across availability zones or regions, and clusters of five or more nodes. In both cases Raft’s throughput held up better than Galera’s.
About these results
These are internal results from MariaDB performance engineering, not independently reproduced benchmarks. Latency was added synthetically, and sysbench is a synthetic workload. Results will differ with your schema, transaction mix, hardware and topology, so validate Raft Cluster against your own workload before you decide.
Try it
MariaDB Raft Cluster is part of MariaDB Enterprise Server 12.3 and requires an active MariaDB Enterprise Platform Plus subscription. The Quickstart Guide shows how to set up a 3-node cluster in a lab or VM environment. The scripts we used to run these benchmarks are available on GitHub if you want to run them yourself. For questions or feedback, contact your MariaDB account team or contact us directly.
Temporary (or final?) location of the detailed logs and results: scenario A, scenario B