
MariaDB Enterprise Manager is a comprehensive observability and management solution for your entire MariaDB fleet. As an integral component of MariaDB Enterprise Platform, it delivers advanced, topology-aware monitoring and a robust set of visual tools for query development and schema management – accessible from a single, centralized interface. Built by the team behind MariaDB Enterprise Server, it provides deep integration and a cohesive workflow purpose-built for MariaDB.
Full stack observability and management, purpose-built for MariaDB
Choosing a native observability and management solution provides benefits that are hard to replicate with a mix of third-party tools: seamless integration and reliability, a cohesive user experience, subscription value without additional procurement steps, and simplified support from a single vendor.
Seamless integration. Enterprise Manager understands MariaDB topologies – primary/replica and Enterprise Cluster including MaxScale – and visualizes them natively. See relationships in context and drill down into MaxScale GUI from the same view, with SSO via your existing IdP.
A cohesive workflow. One interface for monitoring and alerting, query development, schema design and schema management. Fewer context switches mean faster diagnosis and safer changes.
More value, less sprawl. Enterprise Manager delivers telemetry built on open standards (OpenTelemetry, Prometheus) and ships with built-in Grafana with pre-packaged dashboards and alerting – so you can standardize your monitoring without bolting on extra tools.
Resolve incidents faster with advanced monitoring
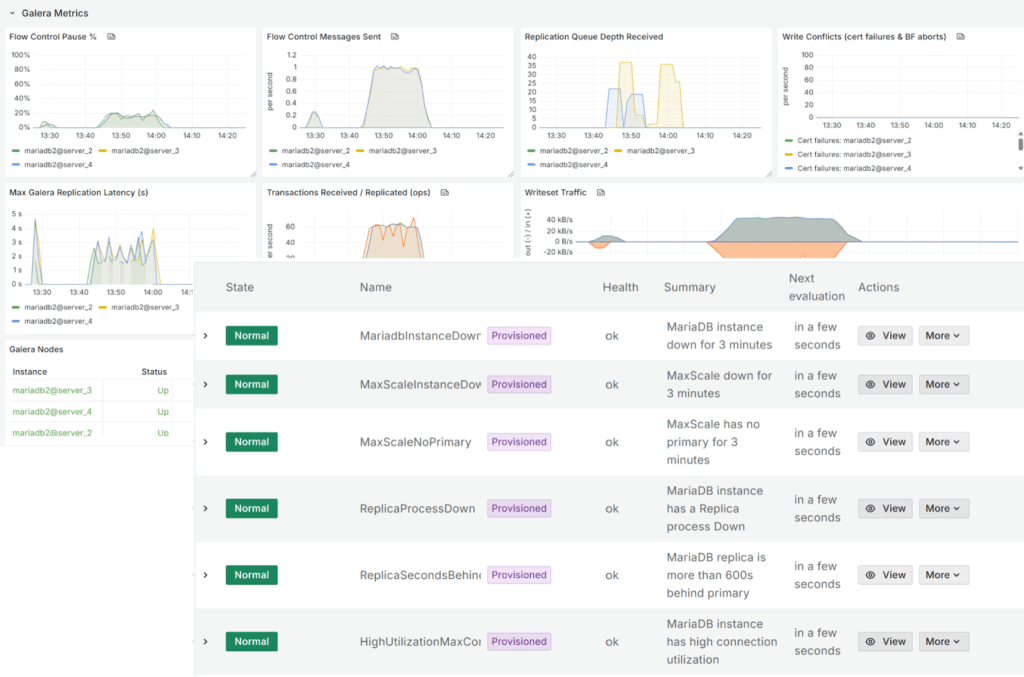
Outages drag on when metrics are scattered and alerts are noisy. Your on-call teams need clear signals, not more noise. MariaDB Enterprise Manager cuts through this by delivering production-ready Grafana dashboards and alerts based on MariaDB engineering best practices.
These dashboards are natively topology-aware, understanding your primary/replica and Enterprise Cluster topologies with MaxScale. It includes built-in Grafana, allowing teams to create and tune custom dashboards and alert rules to match business and operational needs, then rely on Grafana Alerting to power alert logic and notification routing. Set notifications to reach your preferred channels – Slack, PagerDuty, Jira, email and more – so on-call engineers see the right signal fast.
The result is faster incident resolution, higher availability and a monitoring stack that scales with your environment.
Gain a topology-aware view to reduce operational overhead
Operational drag isn’t just an inconvenience; it’s a cost. When your team jumps between five different tools to correlate a performance alert with a schema change or a query plan, you’re losing valuable time.
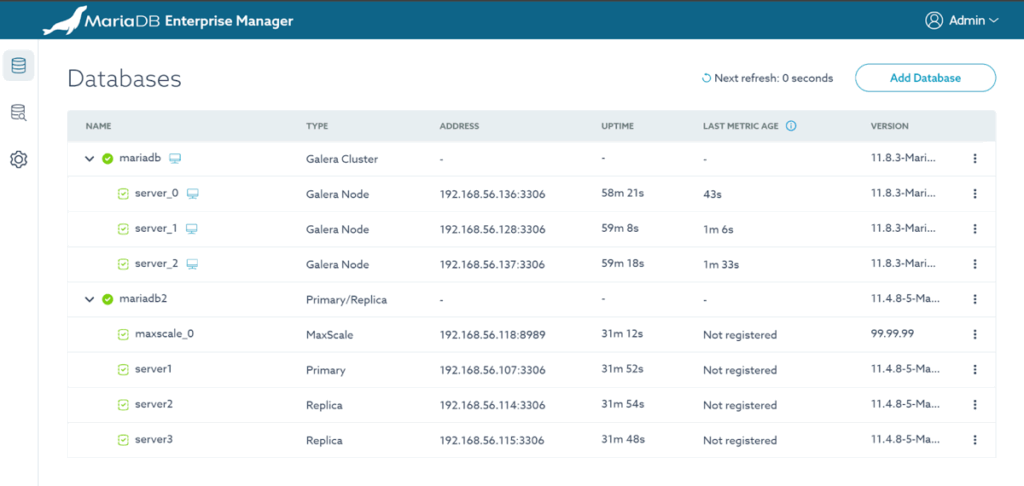
MariaDB Enterprise Manager ends this fragmentation. It provides a single control plane with a topology-based centralized view across your entire MariaDB estate. From one screen, see inventory and health for standalone servers, primary/replica, and Enterprise Cluster topologies including MaxScale. Jump straight into the MaxScale GUI with SSO from the same console to investigate or act without losing context.
The result is lower operational overhead and a single source of truth that scales with your environment.
Go from insight to action – without switching context
Why should your monitoring console only tell you that something is wrong? MariaDB Enterprise Manager’s built-in database workspace empowers you to fix it, right then and there.Work slows when teams bounce between SQL editors, schema design/management tools and monitoring consoles – one secure workspace keeps momentum. We’ve unified the complete workflow.
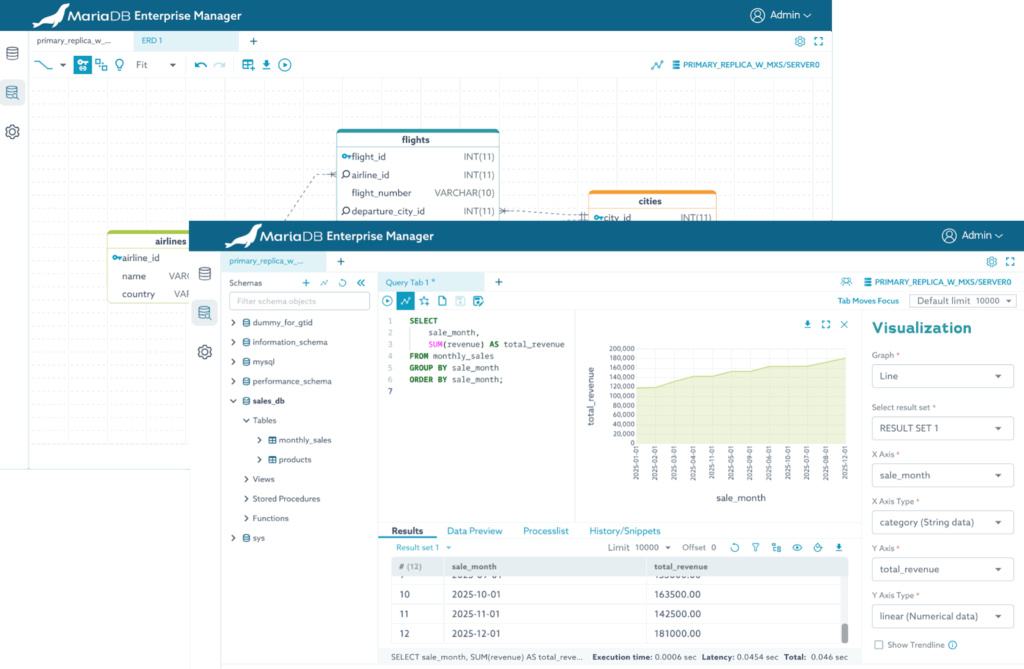
MariaDB Enterprise Manager’s built-in database workspace extends monitoring with a powerful query editor, visual schema management and entity relationship diagram (ERD) design in a shared, browser-based environment. Run and visualize queries across multiple connections, and model or edit databases – tables, columns, indexes, users and permissions – without leaving Enterprise Manager. Additionally, integrate with your corporate identity provider for SSO/MFA and leverage role-based access and audit logging.
The result is fewer context switches, faster changes and compliant, collaborative database operations.
Extend, don’t replace, your observability stack
MariaDB Enterprise Manager is built to integrate seamlessly with the tools you already use. We don’t force you into another data silo.By supporting standards-based telemetry (OpenTelemetry and Prometheus) you have complete flexibility. Emit OpenTelemetry metrics from the Enterprise Manager Agent to third-party platforms, or scrape Prometheus metrics from the Enterprise Manager Server – so you can stream MariaDB health and performance into your existing pipelines and keep your single pane of glass in the existing observability system.
Get started
Ready to try MariaDB Enterprise Manager? MariaDB Enterprise Manager is available to all customers with an active subscription. Get started using the Quickstart Guide to install and begin monitoring and managing your MariaDB environments.
Not a current MariaDB customer? Contact us for a demo and quote.