
The newest release of MariaDB SkySQL includes major new capabilities, such as new topologies for distributed SQL and clustering, and cloud data warehousing with massively parallel processing and HA. With this release, we’ve also expanded SkySQL Monitoring, adding support for these new topologies and refining our monitoring interface.
MariaDB SkySQL relies on our observability platform, its instrumentation and infrastructure, to deliver the high quality of service our customers require. Observability is a key design principle in SkySQL. SkySQL Monitoring makes parts of this powerful tool accessible to our customers. This blog is a brief introduction to SkySQL Monitoring.
Whether operating a simple database-backed application or a very complex enterprise application, SkySQL Monitoring provides a right-sized view of database status and metrics.
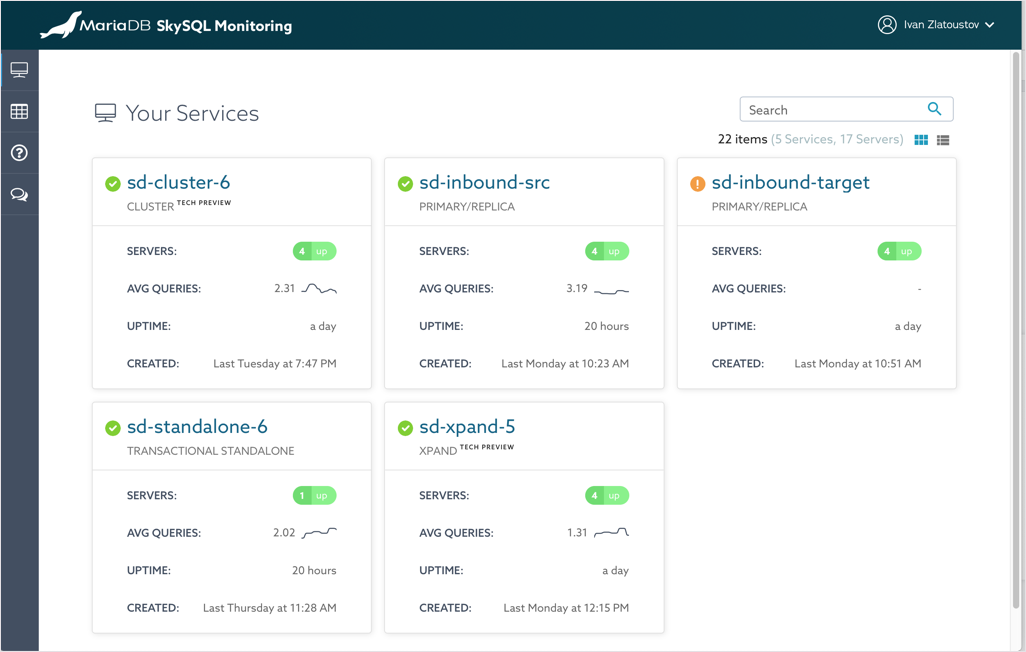
The default SkySQL Monitoring dashboard is an overview of your active services, available as a card or list view, with more details just a click away.
MariaDB Monitoring provides a precise view of database performance characteristics – current and over time – giving customers the power to correlate performance with external events, to investigate changes in normal workload patterns and to explore how changes in queries affect the database service.
SkySQL Monitoring is included with every SkySQL service and supports all the SkySQL topologies, including the two newest additions – Cluster and Distributed SQL. SkySQL Monitoring is accessed from the SkySQL Portal and is available when a service has been launched and is running.
Service Details
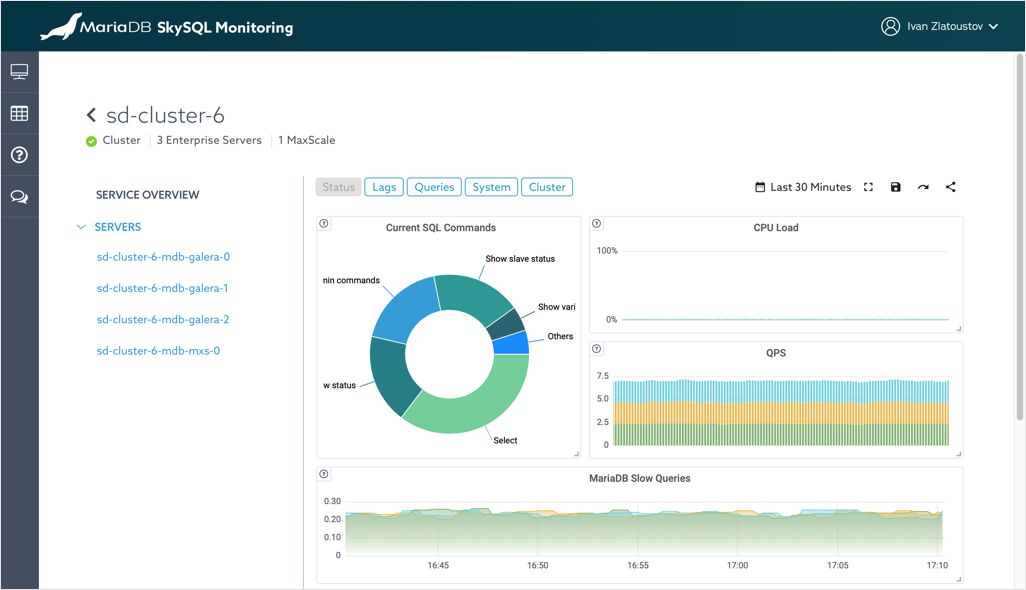
Service dashboards provide a summary of activity across servers.
Clicking on the service name reveals a more detailed dashboard view with service-level focus rather than focus on individual server behavior:
- Top SQL Commands
- CPU Load
- Queries per second
- Status of the replication and the replication lags
- Overall disk usage
Status (shown above) is just the first of many monitoring dashboards. There are other dashboards that present how service metrics have changed over time:
- Lags focus on replication
- Database focuses on database connections, table locks and open tables
- Queries looks at database queries, slow queries, threads etc.
- System deep dives into important system metrics like CPU, RAM, I/O, and network
- Historical gives a historical perspective of the metrics
Each dashboard gives you different insights into your SkySQL database service. To focus on a specific component of the topology, you can navigate to server-specific dashboards.
Server Dashboards
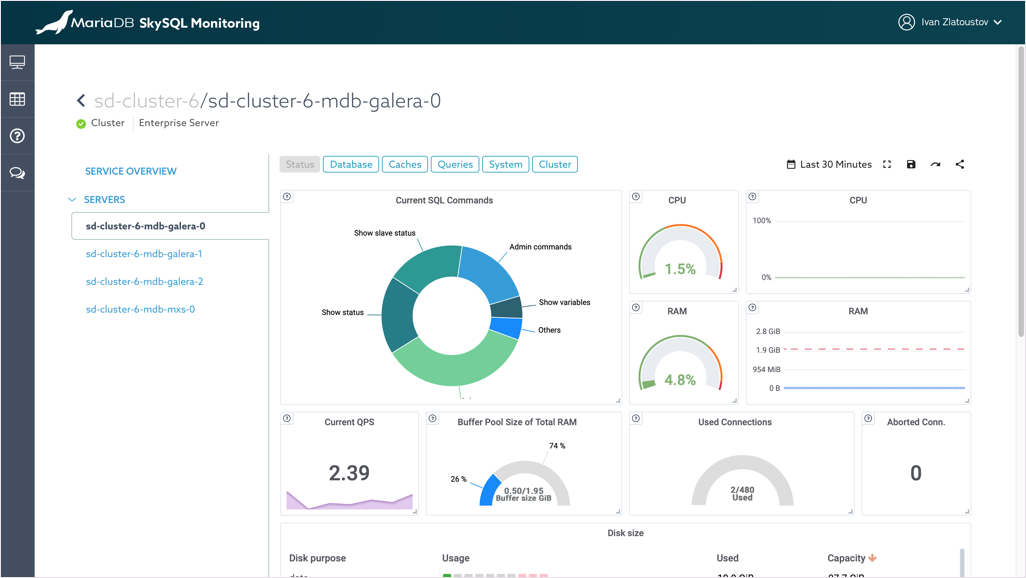
Server dashboards drill down into details of individual servers.
Server dashboards are more specific and more detailed than the service dashboards. Recognizing that different servers or engines have different metrics, there are configuration-appropriate dashboards for each SkySQL topology. For example, if the server uses our elastic and scalable Xpand engine, you will see an Xpand-specific dashboard.
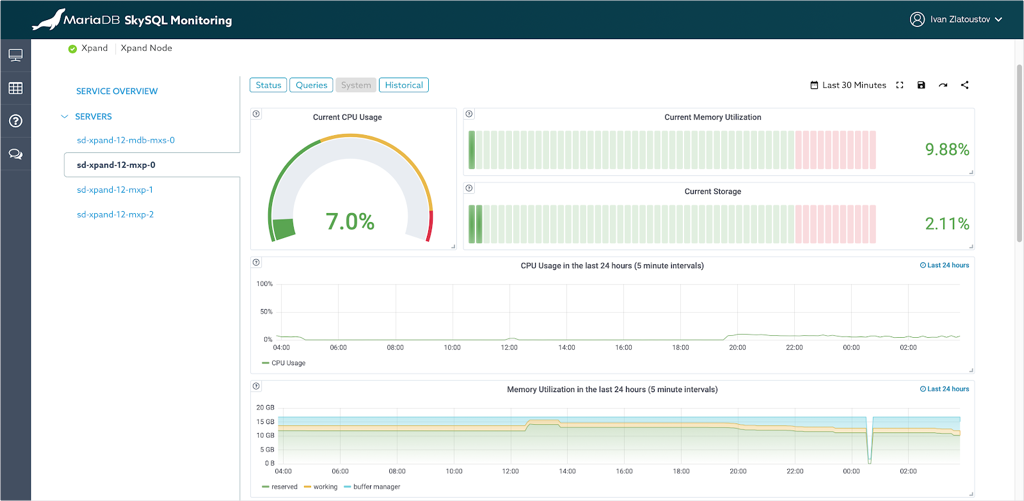
Server specific dashboard for Xpand in SkySQL.
Tailored by Customer
Dashboards can be customized by the customer depending on what’s most important to monitor at a given time. For example, I recently migrated a MariaDB database from a datacenter to SkySQL. The data set was several gigabytes and, transferred over the internet, it took several hours.
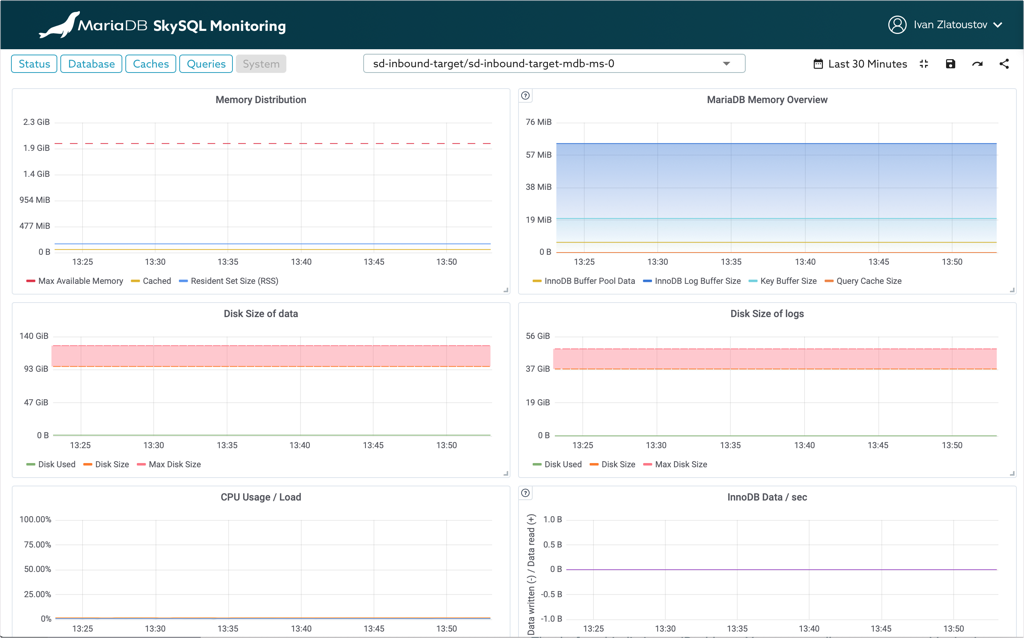
The default system dashboard (full screen) is very useful for general information but you can also create custom system dashboards to monitor the metrics you care most about.
During this migration, the load process was more important than database performance. I wanted to monitor the progress and performance of the process, and I also wanted to monitor for any connection issues that might affect my migration. In SkySQL Monitoring, I went to the System dashboards which have metrics on InnoDB load times, the network, I/O ops and the disk size. I dragged the panels for the metrics I cared about into the right order on one screen and created a new custom System dashboard and saved it for future use.
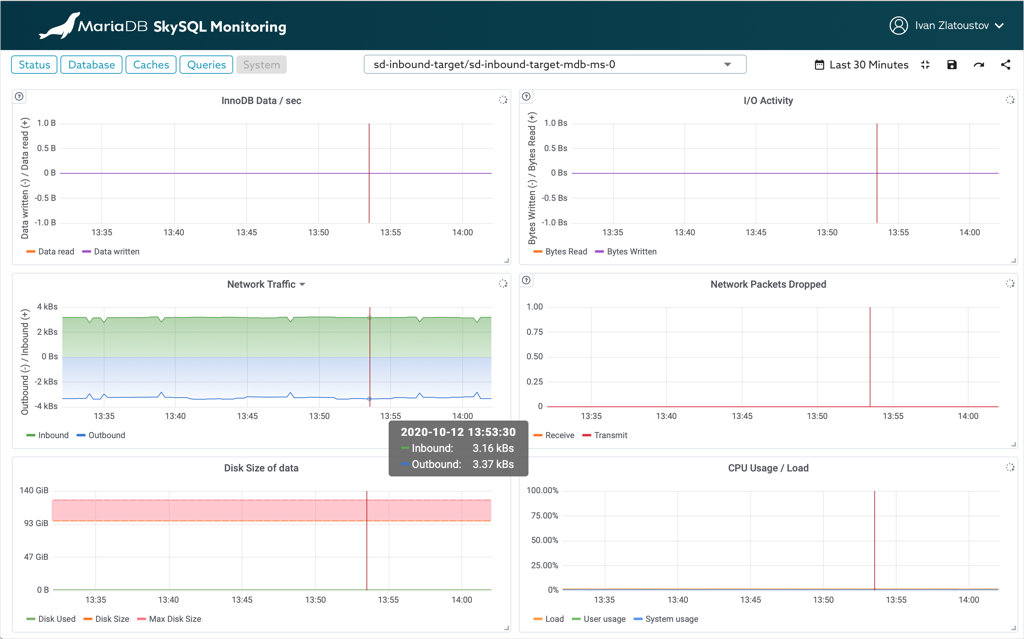
Custom dashboards let you focus on important metrics on the same screen.
That was a very quick introduction to SkySQL Monitoring. It is an expansive tool that provides all available metrics for your database server. The best way to find out more about it is to try it for yourself on SkySQL.
For More Information
Detailed documentation is available at https://mariadb.com/products/skysql/docs/get-started/
More details can be found in MariaDB SkySQL Documentation