
Introduction
Business Intelligence (BI) and Data Science (DS) require processing huge amounts of data in various and complex ways using a vast array of statistical methods and tools. Traditional application architectures separated transactional and analytical systems. Today, corporations need to be agile. This means that using “after the fact” analysis is no longer adequate. This blog post introduces MariaDB Platform X3 and how to leverage its built-in statistical functions for analytical use cases. Furthermore, it demonstrates how MariaDB Platform X3 interoperates with modern DS tools such as Jupyter Notebooks.
For data engineers, data analysts and data scientists, having an interactive computing environment that can drive exploration using notebooks (e.g., Jupyter) and structured query language (SQL) enables reliable iterative conversation between researcher and data. An example of MariaDB Platform support for statistical functions within a Jupyter notebook is presented here.
MariaDB Platform X3 for analytics
MariaDB has introduced Platform X3 which unites transactional and analytical workloads under a single interface. To deliver analytical capabilities, MariaDB Platform uses MariaDB ColumnStore, a columnar data store, as the analytical component. It uses distributed storage and massively parallel processing (MPP) to execute interactive, ad hoc queries on hundreds of terabytes of near-real-time data, with standard SQL and without creating indexes. MariaDB Platform scales on commodity hardware, on premises or in the cloud, eliminating the need to spend budget on proprietary data warehouses and appliances.
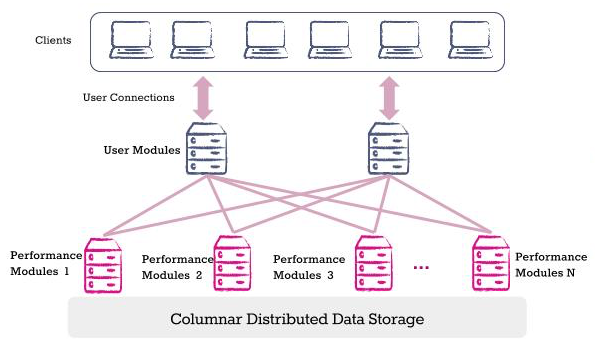
Column oriented data stores (for MariaDB, known as, MariaDB ColumnStore) are more suitable for analytical workloads because the data format lends itself to faster query processing. These database systems have been shown to perform more than an order of magnitude better than traditional row-oriented database systems.
Jupyter Notebook and MariaDB
Jupyter notebooks success is that it excels in a form of programming called “literate programming”. Literate programming allows users to formulate and describe their thoughts with prose, supplemented by mathematical equations, as they prepare to write code blocks.
The MariaDB ColumnStore engine is extremely flexible. When you create a table on MariaDB ColumnStore, the system creates at least one file per column in the table. Thus, in a columnar storage format, the query touches only few columns and it is faster to load all values of a “particular column” into memory from disk in fewer Input/Output (I/O) operations and further into CPU cache in fewer instructions. Visit the MariaDB ColumnStore Storage Architecture page to get the details of the engine.
Now, let’s see how all this fits together with an example. Start by creating a Jupyter notebook. The version of the notebook server in this example is: 5.6.0 using Python 3.7.0.
The pymsql module is used to connect from the Jupyter notebook to MariaDB. Import the module first, just as you would any other module. Then establish a database connection providing user credentials and server information.
from IPython.display import HTML, display, Latex       # Used to display data as HTML tables
import pandas as pd                                    # Used to simplify displaying of the result set from SQL statements
import pymysql as MariaDB                              # Used to connect to MariaDB ColumnStore
import warnings                                        # Used for printing warning messages
# Connection credentials and server information
conn = MariaDB.connect( host = '172.17.0.2'
, port = 3306
, user = 'mdb'
, passwd = 'letmein'
, db = 'test'
, charset = 'utf8')
cur = conn.cursor() # Create a database cursor to process the result set
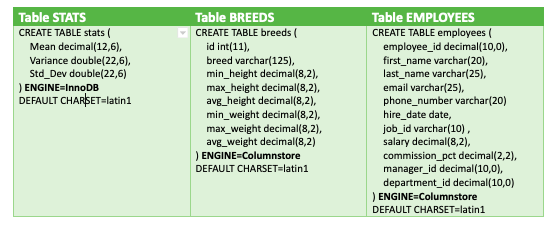
For this example, we are going to use three tables with a few rows. Table employees and breeds have data about employees and dog breeds respectively. Table stats is used to demonstrate basic statistical functions. It holds the result of the mean, variance and standard deviation calculation of the different dog breeds. Employees data is used to demonstrate the advanced statistical functions such as co-variance and correlation.
Basic Statistical Functions
MariaDB Platform introduces a number of aggregate statistical functions used to process complex data sets.
Mean, Variance and Standard Deviation
You have just got data about dog breeds. Each row describes one breed with attributes such as the height and weight of the breed in inches and pounds. Using basic statistics, you need to determine what is the “normal” height and what is “extra-large” or “extra-small” dog breeds. For the purpose of this example, an extra-large or extra-small breed is defined as one standard deviation from the average height mean. The code snippet below can be used to calculate the mean, variance and the “Population Standard Deviation”.
try:
cur.execute("truncate table stats") # Delete all the data
except Exception as e:
print ( "MySQL Error [%d]: %s" % (e.args[0], e.args[1]) )

# Calculate the mean, variance and standard deviation
sql = '''INSERT INTO stats
SELECT AVG( avg_height )
, VARIANCE( avg_height )
, STDDEV_POP( avg_height )
FROM breeds
'''

try:
cur.execute(sql) # Execute query
except Exception as e:
print ( "MySQL Error [%d]: %s" % (e.args[0], e.args[1]) )

conn.commit() # Commit insert

sql = '''SELECT *
FROM stats
'''

try:
cur.execute(sql)
except Exception as e:
print ( "MySQL Error [%d]: %s" % (e.args[0], e.args[1]) )

df = pd.read_sql(sql,conn)
display( df ) # Display the result set
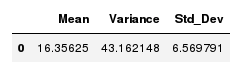
Using the calculations above we can now show the dog breeds that are within one standard deviation (6.5 in.) of the mean (16.3 in.).
# Find all dog breeds that one standard deviation from the mean.
sql = '''SELECT breed AS Breed
, (SELECT Mean FROM stats) AS Mean
, (SELECT Std_dev FROM stats) AS "Std_Dev"
, avg_height
FROM test.breeds
WHERE avg_height > (SELECT mean + Std_Dev FROM stats)
OR avg_height < (SELECT mean - Std_Dev FROM stats) ORDER BY avg_height ''' try: cur.execute(sql) except Exception as e: print ( "MySQL Error [%d]: %s" % (e.args[0], e.args[1]) ) df = pd.read_sql(sql,conn) # Create a derived column to identify the breed as Extra-Large or Extra-Small df['Deviation from Mean'] = df.apply(lambda row: 'Extra large' if row.avg_height>row.Mean+row.Std_Dev
else 'Extra small', axis=1)
display( df )
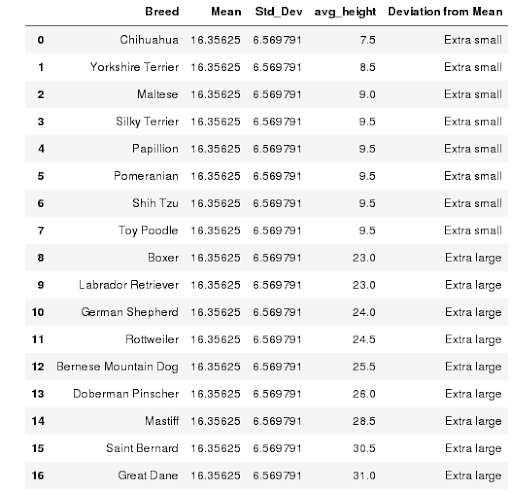
From the output above we can see which breeds are, on average, one standard deviation below or above the mean.
Advanced Statistical Functions
Covariance and correlation were added to the most recent MariaDB Platform X3 version These are two mathematical concepts which are quite commonly used in business analytics. Both are used to determine the relationship and dependency measure between two random variables.
Covariance
In this example, the COVAR_POP aggregate function is used to calculate the population covariance of the full employee data set (use COVAR_SAMP for sample data). The SQL statement below is used to show how two variables, hire_date and salary, are related.
# Calculate the covariance between the number of days since the employee was hired and his/her salary for
# department ids 50 and 80
sql='''
SELECT job_id AS "Job Id"
, COVAR_POP ( DATEDIFF ( SYSDATE(), hire_date ), salary) AS "Covariance Population"
FROM employees
WHERE department_id in (50, 80)
GROUP BY job_id
'''

try:
cur.execute(sql)
except Exception as e:
print("MySQL Error [%d]: %s"%(e.args[0],e.args[1]))

df = pd.read_sql(sql,conn)
display( df ) # Display the result set
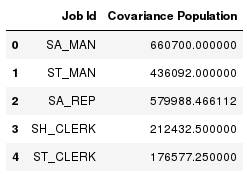
The output shows that hire_date and salary attributes are linearly associated. A positive covariance means the variables are positively related, that is, as the number of days since the employee was hired increases the salary increases as well.
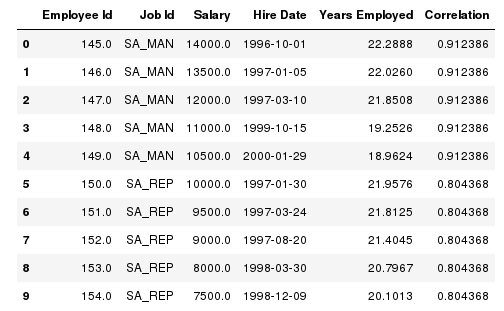
Correlation
The CORR(ColumnY, ColumnX) function can be used to find the correlation coefficient to identify the strength of the linear association between the hire_data and salary attributes.
# Getting correlation between hire date and salary for each job id in deparetments 50 and 80
sql = '''
SELECT employee_id AS "Employee Id"
, job_id AS "Job Id"
, salary AS "Salary"
, hire_date AS "Hire Date"
, DATEDIFF (SYSDATE(), hire_date) / 365.25 as "Years Employed"
, CORR( DATEDIFF (SYSDATE(), hire_date), salary ) OVER ( PARTITION BY job_id ) AS "Correlation"
FROM employees
WHERE department_id in (50, 80)
ORDER BY 2, 1;
'''

try:
cur.execute(sql)
except Exception as e:
print ( "MySQL Error [%d]: %s" % (e.args[0], e.args[1]) )

df = pd.read_sql(sql,conn)
display (df.head(10)) # Display first 10 tuples of the result set
Finally, to terminate the cursor and connection to the database execute the following two lines of code.
![]()
Conclusion
In this blog, Jupyter notebook was used to demonstrate new window and statistical aggregate capabilities of MariaDB Platform X3. Some key takeaways are:
- Columnar Storage – Column oriented data stores are more suitable for analytical workloads because the data format (column format) lends itself to faster query processing — scans, aggregation et cetera.
- Data discovery – Enable data engineers, data analysts and data scientists, to have an interactive computing environment that can drive exploration using notebooks (e.g., Jupyter) and structured query language (SQL).
- Easy to maintain – Database Administrators love the fact that MariaDB Platform X3 does not add complexity to the analytical and exploratory environment.
- SQL front end – Data Scientist has been using SQL for their whole career. No retraining is needed.
Try it out for yourself. Download MariaDB Platform X3.
Additional Resources
MariaDB Origins and versions
https://searchdatamanagement.techtarget.com/definition/MariaDB
ColumnStore Distributed Aggregate Functions
https://mariadb.com/kb/en/library/columnstore-distributed-aggregate-functions/
ColumnStore Architecture
https://mariadb.com/kb/en/library/columnstore-architecture/
ColumnStore SQL Structure and Commands
https://mariadb.com/kb/en/library/columnstore-sql-structure-and-commands/
Python pymysql module
https://pypi.org/project/PyMySQL/
Link to the Jupyter Notebook